Introduction
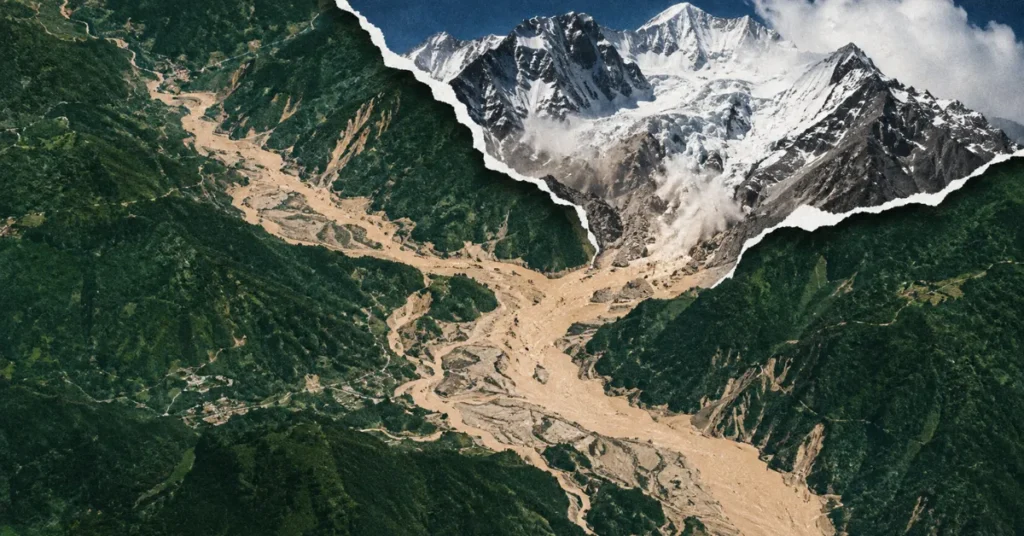
A glacier and the bedrock beneath it broke off the north flank of the Langtang massif, just north of the 7,234-metre summit of Langtang Lirung, on 26 August 2026 and fell more than a kilometre. Seismometers in Germany, China and the United States registered the shaking, and for several hours the world’s monitoring agencies logged it as an earthquake. There had been no earthquake.
Status of the figures. Casualty, damage and volume figures in this article are current to the morning of 29 August 2026 and are still moving fast. Where authorities disagree, both figures are given. This article will be updated as agencies reconcile their figures.
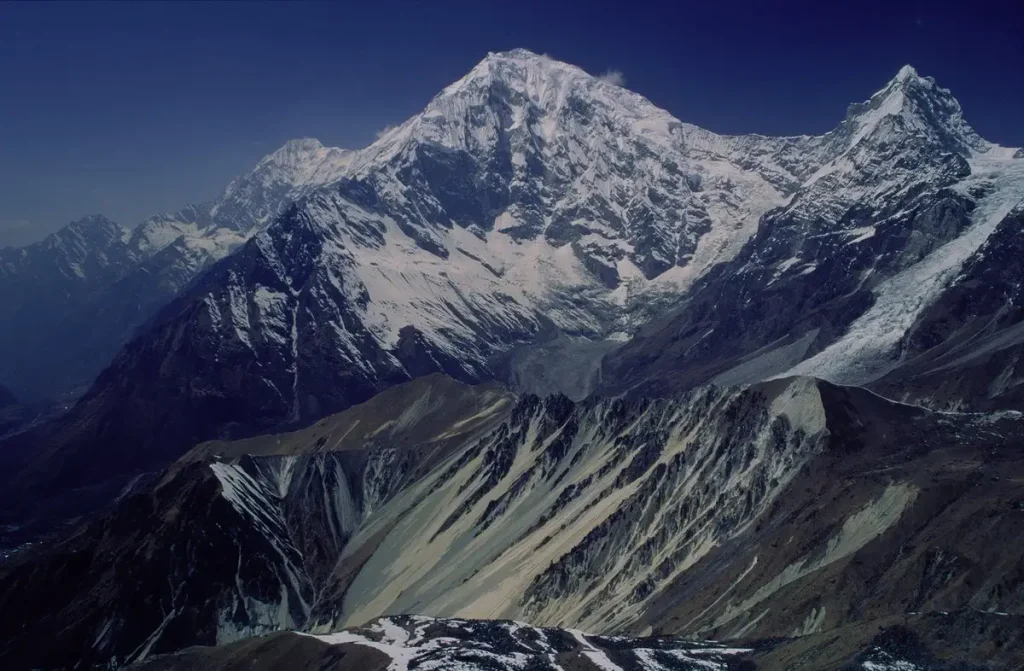
A ridge above the Langtang Valley, 8:37 a.m.
The man filming gave his surname as Hei. He was 34. He was standing on a ridge with a view into the Langtang massif on a clear Wednesday morning, NBC describes the shot as looking into Nepal’s Langtang Valley, though CNN geolocated his footage to the Nepal–China border area near the source.
Six seconds of his wide shot show grey dust rising in the distance. The next shot shows snow on the glacier beginning to run downhill.
He told NBC News afterwards that if someone with the right experience had recognised what they were looking at, an immediate report might have bought a little time.
What he had recorded, without knowing it, was the opening of the deadliest Himalayan mass-movement disaster in a decade.
Roughly twenty kilometres downstream and seven and a half minutes later, a fixed camera above the Gyirong border gate on the Tibetan side of the frontier was recording an ordinary morning of cross-border trucking. In the next frames it fills. A brown-grey front of water, pulverised ice, mud and boulders overruns the customs yard, folds the administrative building, and tosses freight vehicles across the compound. The time stamp reads 10:59 a.m. China Standard Time.
Rescue officials who reached the site days later told Chinese state media there was no discernible outline of any structures left. The port sits deep in the border gorge. Elevation figures for it vary sharply in the reporting, CNN put the site above 3,800 metres, while the Rasuwagadhi crossing on the Nepali side is generally given as under 2,000 metres, and the discrepancy has not been resolved. It was the main overland gateway between Nepal and Tibet, and it no longer exists.
For the first several hours, the world’s monitoring agencies told each other an earthquake had happened. The United States Geological Survey issued a magnitude 4.4. Nepali officials repeated it. Indian outlets ran with it. There had been no fault rupture. What the seismometers had recorded was the mountain itself.
Why the seismometers said earthquake, and why they were wrong
The signal reached the GEOFON station at Flechtingen in Saxony-Anhalt roughly 40 minutes after it left the Himalaya, an ordinary surface-wave travel time for that distance. What was not ordinary was the shape of the energy. The GFZ Helmholtz Centre for Geosciences described a landslide generating such strong seismic signals practically worldwide as extraordinary.
The USGS catalogue is the primary record. The primary event is listed as us7000tbwb, origin time 02:52:10 UTC on 26 August 2026, which is 08:37 a.m. Nepal time and 10:52 a.m. China Standard Time. It sits at 28.271°N, 85.515°E, described as 55 km northwest of Kodāri, Nepal, with focal depth fixed at 0 km. The assigned magnitude is 5.2. Two fields in the catalogue entry carry the finding. The magnitude type is ms_vx, a surface-wave measure rather than a body-wave one. The event type reads “landslide.”
The USGS revised the category, not just the number. Its event page carries a short technical note: the event was initially reported as a magnitude 4.4 earthquake, and additional analysis of long-period seismic waves indicated that the seismic energy was instead generated by a landslide, with the location estimated from satellite images. In its own summary the agency states that the slope failure:
“generated energy equivalent to a M5.2 earthquake,” and its Landslide Hazards Program lists the event under landslides rather than earthquakes.
A magnitude describes the size of a recorded seismic signal. It says nothing about what produced it. Fault slip, a nuclear test, a rockslide and a glacier detachment can all shake the ground hard enough to register on a global network.
Telling them apart means reading the waveform rather than the number. A tectonic earthquake is rich in high-frequency energy, radiated in a few violent seconds from a slipping fault at depth. A large mass sliding down a mountain radiates long-period energy instead, because what the Earth feels is a change in momentum: the mass pushes back on the planet as it accelerates away from the headwall, then pushes back again in the opposite sense as it decelerates on the valley floor. The result is a long, smooth, low-frequency pulse rather than a sharp crack.
Those long-period surface waves are what betrayed the Langtang source. It is the same forensic move seismologists use to tell a nuclear test from an earthquake: read the frequency content, not the amplitude.
GFZ’s independent solution differs from the USGS number, and the gap is real, not a contradiction between agencies. GFZ framed the magnitude as a range of Mw 5.2 to 5.7 in its text, gave 5.69 in the caption to its Flechtingen seismogram, and timed the event at 02:52:23 UTC, thirteen seconds off the USGS origin. Two agencies used two magnitude scales on one event. Neither implies a tectonic earthquake. Both are provisional.
A second signal followed. Roughly three hours later, at 06:00:35 UTC, the USGS logged event us7000tc90 at M 4.2, also classified as a landslide. It was identified in post-processing of low-frequency records and is catalogued at the same coordinates as the first event. Whether that reflects a co-located source or the limits of locating a second low-frequency signal has not been stated. Something large moved a second time, in a valley that had just been stripped bare and loaded with fresh unconsolidated debris.
Preliminary seismic analysis also turned up anomalous signals at two regional Chinese stations. ICIMOD reported unusual traces at Jilong, about 12 kilometres from the affected area, and at Zhangmu, while stressing that no causal link had been established between that seismicity and the flood.
Professor Niels Hovius, who heads GFZ’s geomorphology section and has worked in the region for more than a decade, drew the operational lesson without hedging:
“There is no way to prevent such events. They are natural events, occurring several times per year in the Himalayas. However, early warning systems based on seismic signals are possible. Such a system could have issued warnings downstream with only a few minutes delay. This could give people minutes to tens of minutes to reach safe ground.”
Where the Langtang Lirung flood actually happened, and the valley everyone named wrongly
.jpg)
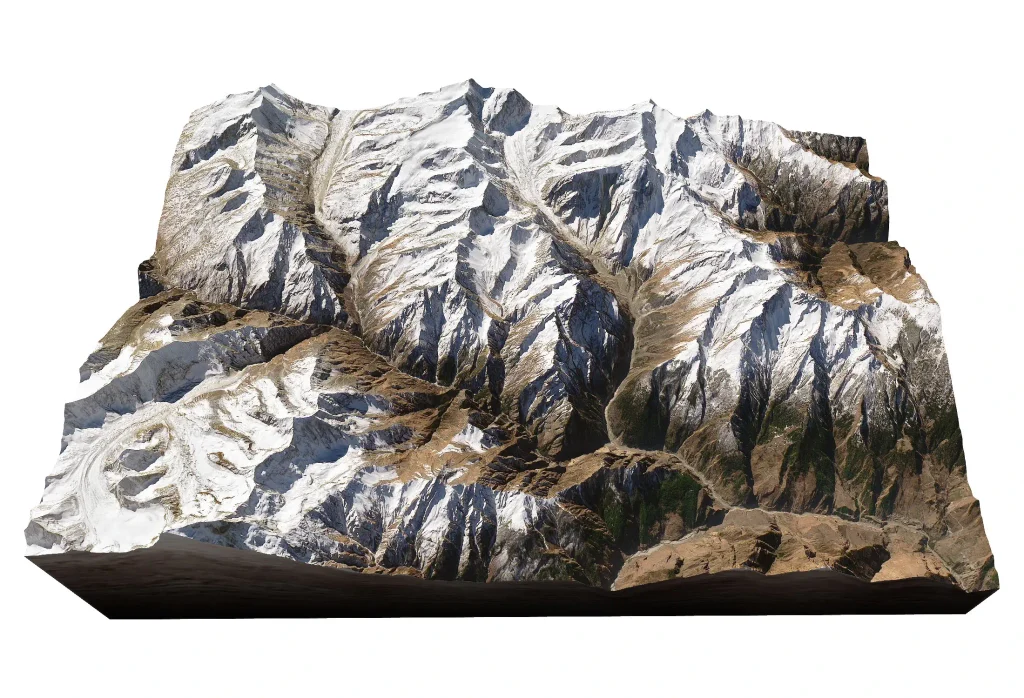
Langtang Lirung is the highest summit of the Langtang Himal, part of a mountain complex, together with the Jugal Himal, that sits between the Trishuli Gandaki valley to the west and the Sun Koshi to the east, southwest of the 8,000-metre Shishapangma. At 7,234 m it is usually listed as the 98th or 99th highest mountain on Earth, with a topographic prominence of 1,534 m. The number that matters for hazard is relief. The peak rises about 5,500 metres above the Trishuli Gandaki in roughly 16 horizontal kilometres, one of the steepest mountain-front gradients anywhere in the Himalaya.
The Langtang catchment drains 585 km², of which about 155 km² is glacierised, and spans an elevation range from around 1,400 m at the confluence with the Trishuli up to the summit. The upper basin above Kyanjing, where the glaciers concentrate, is 350 km², about a third of it ice. The four principal glaciers, Lirung, Shalbachum, Langtang and Langshisha, carry rock debris on their tongues, with most of the mantle sitting below 5,200 m. Lirung Glacier, spilling off the south face, has been the site of glaciological fieldwork since the 1970s and is among the most intensively measured debris-covered glaciers in Asia.
That long record is why the region can say something concrete about change. Work published in 2026 on glacier change in the Langtang catchment since the Little Ice Age found that the Lirung, Langshisha and Ghanna glaciers have been effectively stagnant, moving under 10 metres a year, since 2003. A stagnant debris-covered tongue is a glacier that has stopped behaving like a conveyor belt and started behaving like a decaying pile of ice.
The bedrock is competent. The USGS describes the local geology as high-grade metamorphic rocks: gneisses, quartzites and marbles. Competent rock stays put only as long as the ice buttressing and cementing it stays put.
One point of geography decided who lived and who died, and most early coverage got it wrong. The flood did not come down the Langtang Khola.
Two rivers meet at Syabrubesi. The Langtang Khola drains east to west out of the Langtang valley proper, the trekking valley, the one buried in 2015. The Bhote Koshi comes down from the north out of Tibet through a narrow border gorge, fed near the frontier by the Lhende Khola, known on the Tibetan side as the Donglin Tsangpo. The 26 August collapse fed the Lhende. The flood ran down the Bhote Koshi into the Trishuli.
A second naming trap sits next to the first. The Bhote Koshi that flooded is the upper Trishuli. A different and larger river 65 kilometres to the east is also called the Bhote Koshi, and it was unaffected. Every future evacuation plan in Rasuwa district turns on getting both distinctions right.
Minute by minute: how a collapse became a hundred-kilometre flood
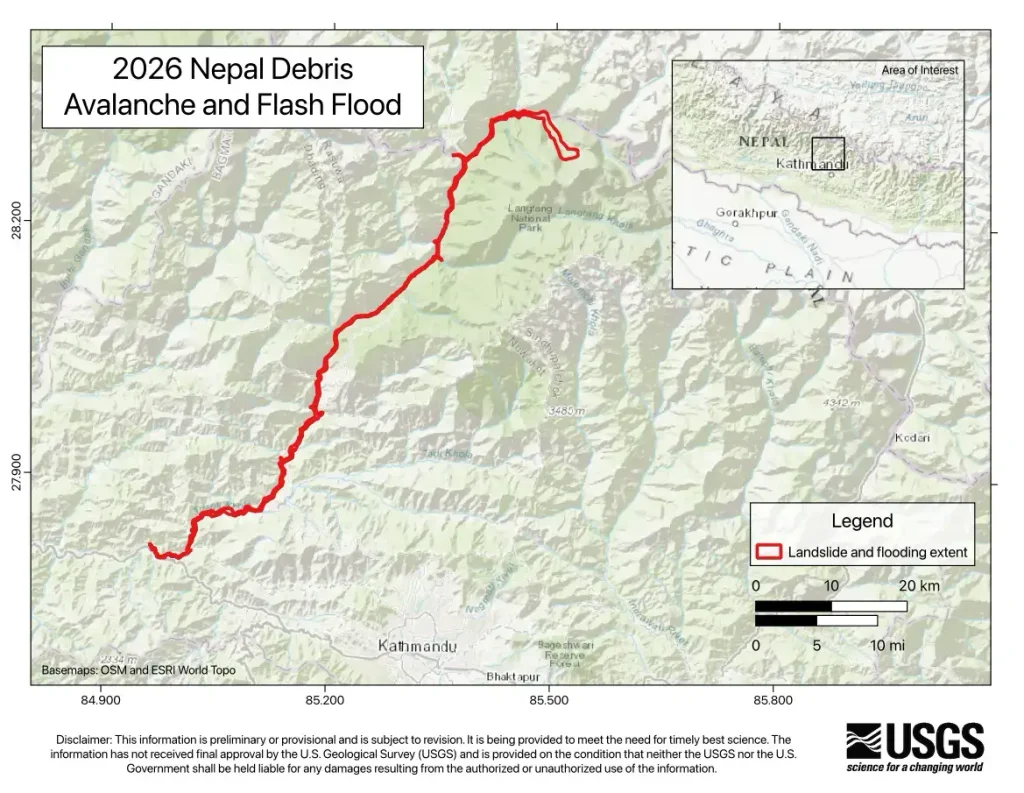
The chain below is assembled from the USGS, GFZ, ICIMOD, the Copernicus Emergency Management Service and named researchers. Several times are reconstructed from seismic and video records rather than directly logged, and all of them are provisional.
08:37 NPT (02:52 UTC): detachment
A mass of ice and bedrock breaks from the north flank of Langtang Lirung. The Copernicus Emergency Management Service states that the material descended approximately 1,200 metres into the Lhende River basin within seconds.
How far it fell is contested, and the disagreement is not trivial. Jakob Steiner, a geoscientist at the University of Graz, put the drop nearly twice as high, and described a different mechanism:
“You basically had the lower part of a glacier tongue that sheared off because the rock below failed. So the glacier had nothing to support itself. That mass of ice and rock dropped from 5,100 to 3,000 meters, damming a river. Once that dam breached, the water accumulated behind it released causing the flood.”
Two independent sources put it near 1,200 m. Copernicus gives that figure directly, and Shugar told Al Jazeera the lower part of the glacier broke off at about 5,200 metres and hit the valley floor about 1,200 metres below. Steiner’s 5,100-to-3,000-metre reconstruction stands alone at roughly 2,100 m. Nobody has measured it on the ground, and until someone does, the low end has two votes and the high end has one.
08:37 to about 08:40: transformation
GFZ’s reconstruction is mechanical and specific. It has the rock and ice shearing down the slope fast enough to generate large amounts of frictional heat, melting a huge volume of ice almost instantaneously. Solid ice became water in seconds. Scouring boulders, rubble and sediment out of the stream bed and off the valley shoulders as it went, the mass turned into a debris flow.
A scientist quoted by CNN reached for a comparison: what hit the villages behaved like liquid concrete.
08:44 to 08:45 NPT: Gyirong
Kristen Cook, a geomorphologist at Université Grenoble Alpes, gave NBC News the tightest timing anyone has published:
“We measured about 7 1/2 minutes between the start of this big slope collapse and the arrival of the flow at the Chinese border post.”
NBC, reporting Cook’s reconstruction, put the average over that first stretch at more than 150 km/h. Independent estimates run higher. GFZ, working from the seismic record and the videos, put the wall of water at several tens of metres high and 40 to 50 metres per second, which is 144 to 180 km/h, though GFZ rendered it conservatively as more than 130 km/h. Jeffrey Kargel of the Planetary Science Institute told CNN the flow covered the first 22 kilometres at an average of 193 km/h. The estimates overlap but do not converge, and none of them has been published in a reviewed form.
The surveillance time stamp at Gyirong reads 10:59 a.m. local time. GFZ’s summary records that everything built at the crossing was destroyed and that a deep mass of debris now sits where the compound stood.
About 08:51 NPT: Syabrubesi
Cook told NBC News the floodwaters took about six more minutes to reach Syabrubesi, slowing to roughly 140 km/h over that reach. ICIMOD reported that water levels in the Bhote Koshi basin began rising rapidly around 9:00 a.m. local time, which brackets the same arrival from the hydrological side.
Within the Syabrubesi mapping tile alone, Copernicus renders it “Syapru Besi”, the service counted more than 240 buildings destroyed and 32 damaged.
About 09:20 NPT: Betrawati, and the first minutes that could have been used
After Syabrubesi the wave progressively slowed. By Cook’s reconstruction, Betrawati had roughly 45 minutes between the collapse and the arrival of the flood.
Forty-five minutes is enough time to move a village uphill, and it went unused, because nobody downstream knew the mountain had moved.
Downstream propagation
ICIMOD reported that the Trishuli at Galchhi rose by as much as nine metres within 30 minutes, and that levels at Malekhu rose seven metres over a similar period. GFZ recorded a rise of more than 10 metres at the confluence with the Seti Gandaki, and the flood was still detectable beyond the Himalayan mountain front.
The USGS puts total runout at approximately 100 kilometres. GFZ describes a zone of destruction extending more than 100 kilometres down the Trishuli valley, striking dozens of settlements across Rasuwa and Nuwakot.
On mechanism, the USGS declined to choose: “it is unclear if the initial slope failure was a landslide incorporating part of a glacier or a glacial collapse.”
How satellites found the Langtang Lirung collapse scar
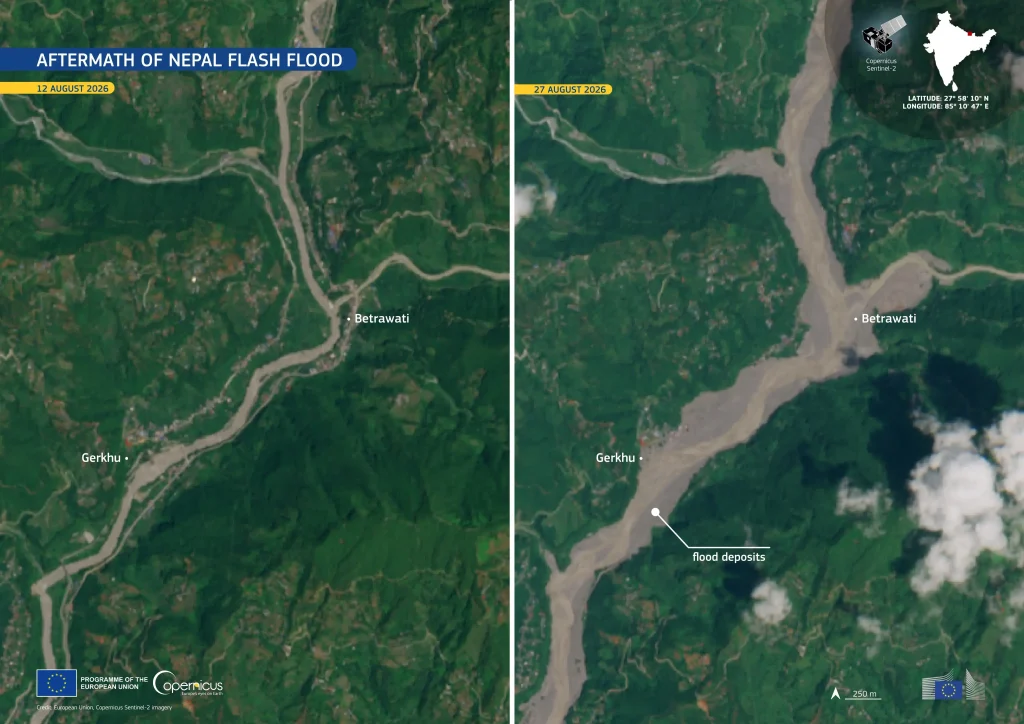
Because the source location could not be triangulated from the seismic data alone, satellites carried the identification. Dan Shugar, an Earth scientist at the University of Calgary, posted an animation built from Planet imagery comparing 25 and 26 August. Dave Petley, writing the same day on the AGU/Eos Landslide Blog, put the source at roughly 28.2765°N, 85.5194°E and concluded that while the exact sequence was not yet clear, the imagery definitely pinned down the location. A second widely circulated coordinate, 28.2853°N, 85.5252°E, sits about a kilometre away, which is the scale of the uncertainty rather than a disagreement about which mountain.
A well-timed Landsat 9 overpass the following day captured the downstream effects across the whole corridor.
Shugar revised his own reading as the imagery improved:
“It looks to have been a large rock avalanche (a big bedrock landslide) that took part of the glacier with it. We don’t know exactly how big yet but big.”
Cloud and airborne debris obscured the summit for much of the first day, the same problem that hampered imaging after the 2015 earthquake. Sentinel-2 optical imagery captured the downstream signature cleanly instead.
The Copernicus Emergency Management Service formally activated its Rapid Mapping component under code EMSR927, mapping flood extent and damage across four areas of interest.
Four instrument classes are carrying the reconstruction:
- Broadband seismometers. USGS, GFZ/GEOFON, and the regional Chinese stations at Jilong and Zhangmu. These fixed the timing and the energy release, and they are the only sensors that saw the event as it happened.
- Optical satellites. Sentinel-2 and Landsat for free, repeat, wide-swath coverage; commercial Planet and WorldView for the resolution needed to see the scar itself. The Copernicus damage tiles were built on WorldView-3 imagery acquired on 27 August at 05:05 UTC.
- Topographic differencing. Subtracting a post-event digital elevation model from a pre-event one is the only way to get a defensible volume. Until high-resolution stereo models are processed, every volume figure in circulation is an estimate.
- InSAR time series. Radar interferometry can detect slow pre-failure deformation on some slopes. The Ahmed et al. Perspective states the limitation plainly: large ice-rock avalanches may or may not show short-term visible precursors, though multi-year satellite records increasingly reveal subtle pre-failure deformation, fracturing and thermal change at susceptible slopes.
What is an ice-rock avalanche, and why did this one travel 100 km?
An ordinary rockslide of a few million cubic metres does not reach settlements 100 kilometres away. This one did, because of a transformation glaciologists have now documented repeatedly across High Mountain Asia: a dry, fragmenting rock-and-ice avalanche converts into a highly mobile, water-charged debris flow.
Mobility comes from three things.
Fall height
Potential energy scales directly with drop. A vertical kilometre delivers enormous kinetic energy to the valley floor, and much of it is spent shattering the mass into fragments small enough to flow rather than tumble. Fall height, still unresolved at Langtang, therefore sets the energy budget for everything downstream.
Ice content and frictional melting
The heat generated as the mass shears down the slope flash-melts ice into water. That water lubricates the mixture and collapses its internal resistance, so a pile of rock that would normally stop at the base of the slope keeps going.
Petley listed the plausible water sources and flagged his own speculation honestly: ice converted to water by the energy of the initial collapse, water embedded in the sediments entrained en route, and river water. He was equally direct about what the evidence did not support, writing that there is no evidence that this was a GLOF.
Bulking through entrainment
The flow scours its own channel, picking up loose sediment, boulders, snow and streamflow as it goes. The volume arriving downstream can be many times the volume that first detached. This is the single most important reason a modest-sounding source volume produces a catastrophic downstream flood.
Whether Langtang bulked the same way is untested, because the volume has not been measured. The runout distance and the sediment load visible in the Sentinel-2 before-and-after frames are consistent with it.
The nature of the initial failure matters for hazard mapping, and it is unresolved. Petley read it as a rock-ice avalanche. Shugar leans bedrock-dominant. GFZ described the break-off of a hanging glacier and underlying bedrock. The USGS declined to choose between a landslide incorporating part of a glacier and a glacial collapse. What is unresolved is the partition between rock and ice in a mass nobody has yet measured.
Chamoli, Sedongpu, Sikkim, Blatten: four ice-rock avalanches compared
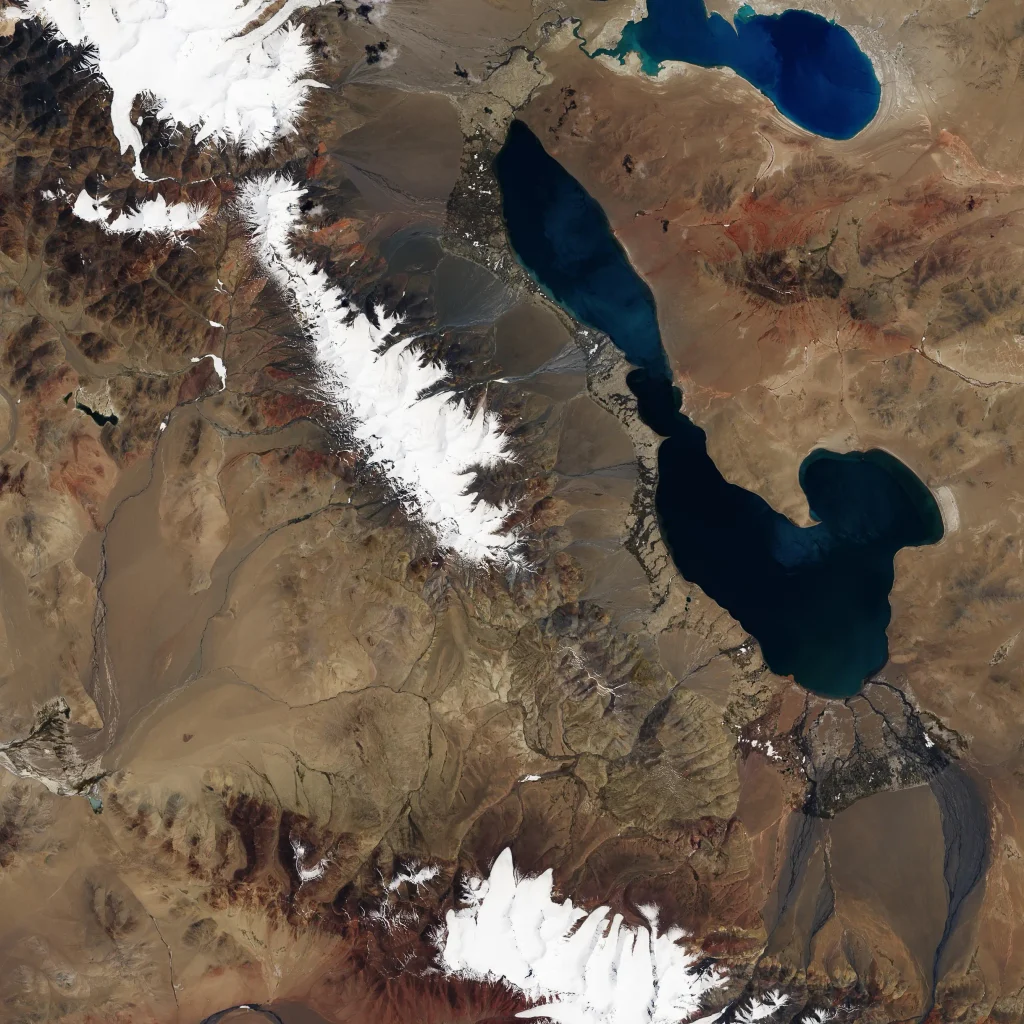
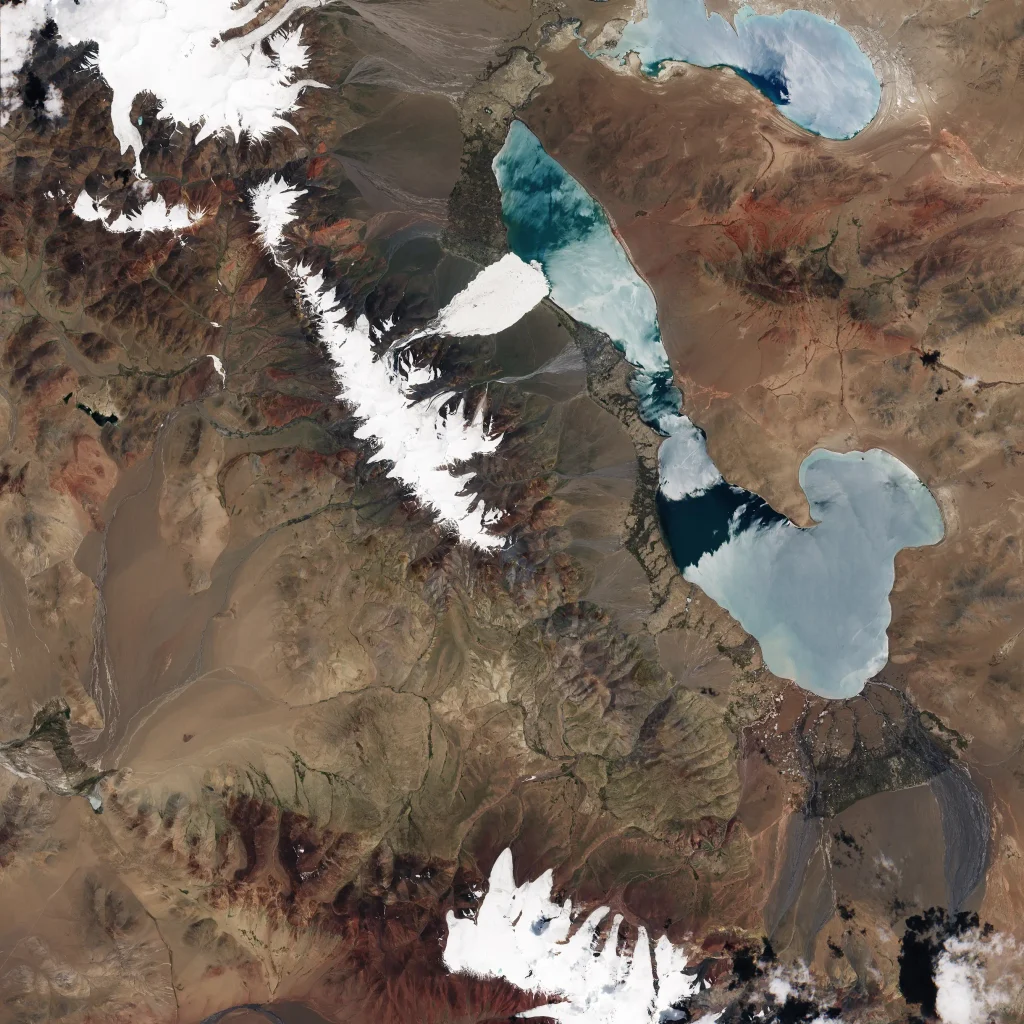
The Langtang collapse joins a series that the peer-reviewed literature increasingly treats as one hazard class rather than as scattered anomalies. Ahmed and colleagues note that ice-rock avalanches remain under-documented in Himalayan hazard assessments, mostly because they occur rarely, and that most disaster databases still group them under broader headings such as “landslides” or “glacial hazards”, which limits systematic recognition of their distinct failure mechanisms, triggers and extreme mobility.
| Event | Source volume | What made it lethal | Deaths |
|---|---|---|---|
| Chamoli, India 7 Feb 2021 | ~27 × 10⁶ m³ rock and glacier ice | Transformation into an exceptionally mobile debris flow; two hydropower plants in the path | >200 |
| Sedongpu, Tibet Oct 2018 | 8.5 × 10⁶ m³ hanging glacier (Li et al.); 130 ± 5 × 10⁶ m³ whole-glacier detachment (Kääb & Girod) | Entrainment: growth to ~1.17 × 10⁸ m³ of debris over just 8 km | 0 (uninhabited) |
| Sikkim, India 3 Oct 2023 | 14.7 × 10⁶ m³ frozen lateral moraine | Impact wave into a glacial lake; a true GLOF; 1,200 MW dam destroyed | 55 dead, 74 missing |
| Blatten, Switzerland 28 May 2025 | 2.9 × 10⁶ m³ ice + 6.4 × 10⁶ m³ rock (~20 Mt) | Buried ~90% of a village. Evacuated nine days early. | 1 |
Chamoli, 2021: the physical template
Shugar and 52 co-authors reported in Science that around 27 × 10⁶ m³ of rock and glacier ice collapsed from the steep north face of Ronti Peak, detaching at about 5,500 m. The avalanche converted almost immediately into a debris flow the paper calls “extraordinarily large and mobile”, one that carried boulders more than 20 metres across and stripped the valley walls to 220 metres above the floor. More than 200 people were killed or are missing.
Chamoli was also, in early reporting, incorrectly labelled a GLOF. The same misclassification reflex appeared at Langtang within hours.
Sedongpu, 2018: the clearest case of bulking, and a warning about volumes
Li and colleagues reconstructed the 2018 Sedongpu event in two phases. A hanging glacier of 8.5 × 10⁶ m³ collapsed onto the trunk glacier below. Roughly 1.17 × 10⁸ m³ of eroded material then transformed into a debris flow and travelled 8 kilometres, scouring valley walls to 180 metres and cutting a scar 142 metres deep and 433 to 744 metres wide.
Kääb and Girod describe the same valley with very different numbers, and the gap between them is the lesson. They put the October 2018 glacier detachment at 130 ± 5 × 10⁶ m³, and then document what happened afterwards: between December 2018 and 2022, and particularly during summer 2021, about 335 ± 5 × 10⁶ m³ was eroded from the former glacier bed, carving a new canyon up to 300 m deep, 1 km wide and almost 4 km long. Adding several later rock-ice avalanches, more than 600 × 10⁶ m³ has left the basin since around 2017.
Two lessons follow. First, published volumes for the same event can differ by an order of magnitude depending on what exactly is being measured. Second, the landscape keeps moving for years after the headline event. Kääb and Girod note that recent erosion volumes at Sedongpu are, to within an order of magnitude, comparable to the average annual denudation volume of the entire Brahmaputra basin upstream of where the river leaves the Himalaya.
Sikkim, 2023: what a real GLOF looks like
Sattar and colleagues, an international team drawn from nine countries, reconstructed the October 2023 South Lhonak disaster in Science: 14.7 × 10⁶ m³ of frozen lateral moraine collapsed into the lake at 5,200 m, generating an ~20-metre tsunami-like impact wave that breached the moraine and drained ~50 × 10⁶ m³ of water. The resulting GLOF eroded ~270 × 10⁶ m³ of sediment, five times the volume of water released, and destroyed the 1,200 MW Teesta III dam. The lateral moraine had been displacing more than 15 metres a year since 2016.
This is the category Langtang appears not to belong to, and the contrast is the reason the label matters.
Blatten, 2025: the counterfactual
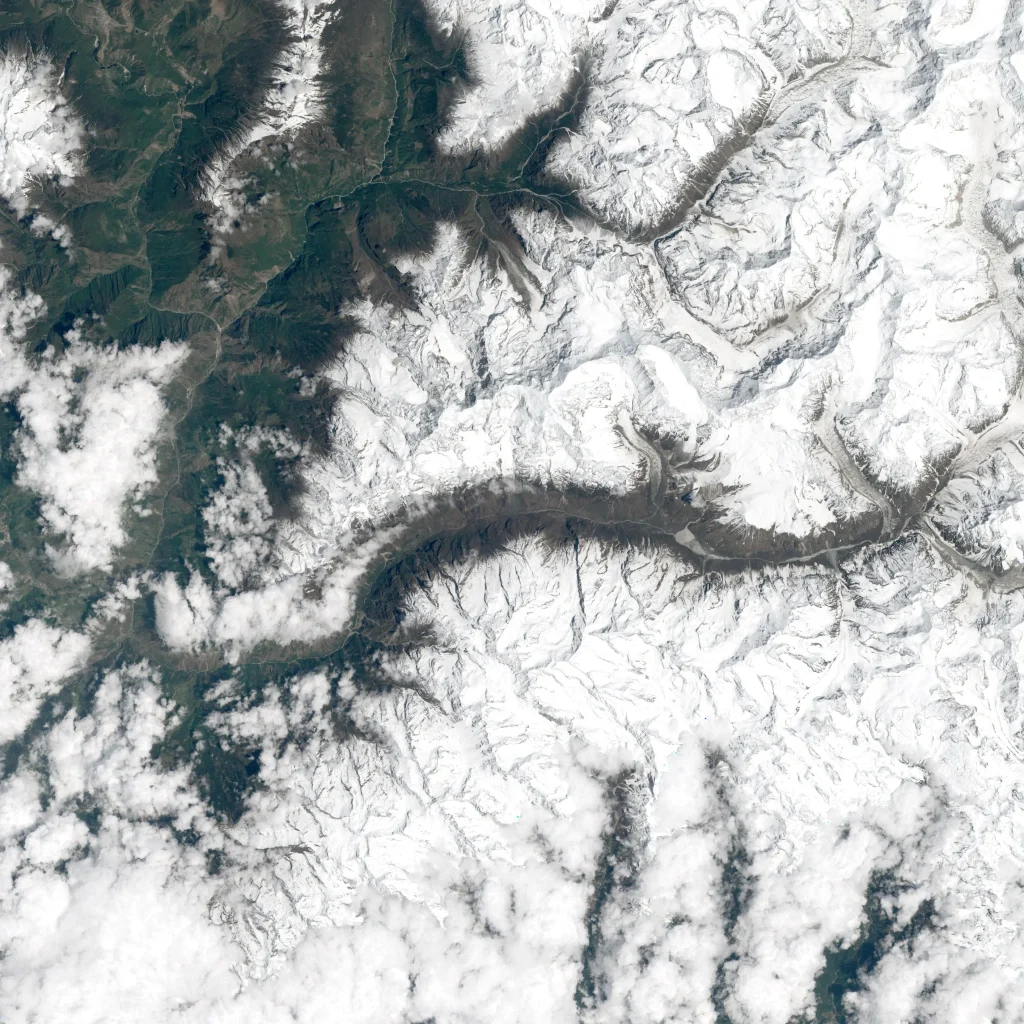
On 28 May 2025 an estimated 20 million tonnes of ice and rock, 2.9 × 10⁶ m³ and 6.4 × 10⁶ m³ respectively, travelled at up to 200 km/h over 1,200 metres of vertical distance to the valley floor, then ran nearly 200 metres up the opposite slope. Around 300 people and their livestock were evacuated. More than 300 buildings were destroyed in Blatten and another 70 in the neighbouring settlement of Ried, among them a rare ensemble of historic timber houses from the 16th and 17th centuries. Estimated economic losses exceed CHF 320 million.
One person died: a shepherd who had returned to an area outside the evacuation zone.
The local population and their animals had been evacuated between 17 and 19 May, nine days before the collapse, under an order giving residents two hours to leave. The trigger was measurable. Cantonal and federal teams deployed radar interferometry, GPS and thermal and optical cameras within days of the first reports and confirmed that the slope was accelerating. On 19 May the authorities ordered Blatten evacuated, giving residents two hours to leave.
Two further details make Blatten a sharper comparator than it first appears. The Birch Glacier had been under observation since a major icefall on 18 December 1993, so a monitoring habit and an institutional memory already existed. Swiss hazard zones are mapped and updated at cantonal and communal level and feed directly into land-use planning, and this event still fell outside the scenarios the map was built on. What worked was not the map. It was the monitoring and the evacuation chain. The map did not anticipate the collapse; the monitoring and the evacuation chain did.
Büntgen and colleagues put the event in a longer frame in Communications Earth & Environment: the disaster followed the warmest decade since at least 742 CE. A tree-ring record is what makes “unprecedented” a measurement rather than an adjective.
The barrier lakes: the hazard that did not end on 26 August
The landslide dam turned an avalanche into a compound hazard. A mass movement blocks a river; a lake grows behind a temporary, unconsolidated barrier; the barrier fails; a second surge is released. It is the sequence that made Sikkim so destructive downstream, and ICIMOD’s specialists invoked it within hours. Saswata Sanyal, a DRR specialist at ICIMOD, put it in one line: “These are cascading hazards: a cryosphere event becomes a flood in a settlement within hours.”
A lake of roughly 2 million cubic metres formed about 11 kilometres northeast of the Nepal–Tibet border, at the foot of the collapse. Chinese authorities warned that a breach was a live possibility given expected further inflow. Rescue work at Gyirong Port was suspended on 28 August because of the risk of a second wave, and evacuation orders were issued for the port area.
What happened on 28 August was less violent than feared. The lake broke its banks, but the river rose only about 0.6 metres. CCTV later reported the water level down about 10 metres and the risk gradually decreasing. Nepal and China resumed rescue work the same afternoon.
Then aerial footage revealed a second blockage further upstream, larger than the first by surface area. Jeffrey Kargel of the Planetary Science Institute called the second lake “extremely concerning” on 28 August, noting that perched water is by definition an unstable mass. By 29 August the assessment had softened: the IFRC’s Nepal delegation head described the Friday overflow as nowhere near Wednesday’s magnitude, and researchers quoted by NBC News judged the two lakes unlikely to produce major flooding. Nepal continues to monitor both. Rain remains forecast for Gyirong County.
The routing is transboundary by construction. The source sits on the divide near the frontier. The Lhende Khola feeds the Bhote Koshi, which is the border river through the Rasuwagadhi–Gyirong gorge. The Bhote Koshi becomes the Trishuli, which runs south through Rasuwa, Nuwakot, Dhading and Gorkha toward Chitwan.
Bodies were carried extraordinary distances. Some were recovered 240 kilometres downstream, as far as Nawalparasi in Nepal and the Kushinagar and Maharajganj districts of Uttar Pradesh in India. A flood that starts on the Tibetan side of a glaciated peak becomes, within a day, a body-recovery operation on the Gangetic plain.
The human toll: pilgrims, tunnel crews, and a border erased
The casualty figures are provisional, they rose steeply across three days, and the authorities do not agree with each other.
Day one diverged immediately. The Associated Press reported at least 160 deaths across Nepal and China by late on 26 August, then more than 360 dead with over 1,400 missing. Petley, writing that afternoon, noted reports of around 400 fatalities and said flatly that he expected the true cost to be higher.
By the evening of 28 August the picture looked like this:
- Nepal’s NDRRMA put the toll at 579 dead and 1,924 missing in its 7 p.m. bulletin. (By 29 August the aggregate figure had risen to at least 626 dead, with close to 3,000 people missing across Nepal and Gyirong County combined.)
- Nepal Police were separately counting 547 by 3 p.m. on 28 August; an earlier police figure the same day was 489 recovered with 2,381 unaccounted for.
- Nepal Police gave 616 dead on Saturday morning, 29 August, and a combined figure of 2,301 people “injured and rescued”, a category that mixes the two and cannot be compared directly with NDRRMA’s count of 101 injured in hospital.
- On the Tibetan side, Chinese authorities confirmed at least five dead in Gyirong County on 28 August; aggregated tallies since put the figure at seven. Missing counts range from 554 to 558, including 260 foreign nationals.
- The IFRC estimated that 93,000 people were affected.
These counts have not been reconciled with one another, and they are not going to be for some time.
The geography of the recovered dead is itself informative. On the 579 tally, 233 of Nepal’s recovered dead were found in Chitwan and 154 in Nawalparasi East, both far downstream, against just 12 in Rasuwa, the district where the flood began. Rasuwa’s low count reflects where bodies came to rest, not where people died: the flood carried them out of the district.
The composition of the missing list explains why this corridor was so exposed. Of the 1,924 people listed as missing in Nepal, 933 are linked to hydroelectric project sites, 517 are foreign nationals and 127 are Nepalis living abroad.
This corridor is simultaneously a construction site and a pilgrimage route. The Rasuwagadhi–Gyirong crossing is the main overland gateway for the Kailash Mansarovar Yatra, and late August is peak season. More than 500 foreigners were among the unaccounted for, with reported country counts ranging from 32 to 34. India’s foreign ministry listed 255 of its nationals as uncontactable with 84 rescued. Around 90 Americans were unaccounted for. Australia reported at least 39 missing, revised upward from 34, alongside A$5 million in humanitarian assistance; Canada listed 32 citizens and South Korea eight nationals working at a hydropower construction site. Nepal’s own Tourism Board maintained a separate list of 590 tourists out of contact, 476 of them foreign and 114 Nepali.
Among the missing were Nepali state personnel: 45 Nepali Army personnel, 28 Nepal Police officers and 13 Armed Police Force personnel, along with 15 customs employees and 15 immigration officers. Three more people were listed missing from Langtang National Park. Fifteen customs officers and fifteen immigration officers were at the crossing when it went.
Rescue teams had brought 4,451 people to safety by the evening of 28 August, 129 of them foreign nationals, including 517 evacuated by air that day across 99 flights using 16 helicopters. Tunnel rescues began early and were still unfinished three days later. The Prime Minister’s secretariat reported that Nepali Army teams had brought 350 people out of the tunnel at the Trishuli 3A Hydropower Project in Rasuwa in “extremely risky” conditions; as of Saturday 29 August, more than 100 people were still trapped inside. NDRRMA’s 28 August bulletin separately logged 191 people rescued from a hydroelectric tunnel, the two counts have not been reconciled. Hospitals were treating 101 injured. NDRRMA reported 15,431 security personnel mobilised: 6,755 from the Nepali Army, 4,473 from Nepal Police and 4,203 from the Armed Police Force.
The response was constrained by the same terrain that funnelled the flood. Water levels at Syapru Besi and Timure were too high for helicopters. Roads into the upper valley were destroyed early. On the Chinese side, deep sediment blocked rescue teams; Chinese rescuers reached the land port on Friday afternoon.
CNN reported one death in particular. Mukesh Nepal, a geologist on the Upper Trishuli Hydropower Project, was getting ready for work at 8:30 a.m. on Wednesday. When colleagues last saw him, he was in a car with a driver heading toward a tunnel near the worksite, to warn the people inside.
The council of ministers declared the area a disaster zone for three months under the Disaster Risk Reduction and Management Act 2074, offering free medical treatment for the injured and financial assistance to bereaved families.
Hydropower on the riverbank: a concentrated, predictable loss
Hydropower in this corridor is built on the riverbank, because that is where the gradient and the buildable ground are, and it is precisely the corridor a debris flow occupies.
Two agencies published incompatible numbers on the same day. The Ministry of Energy put the lost capacity at 431 MW. The Nepal Electricity Authority counted 14 projects and about 748 MW, split into nine operating plants totalling 354 MW and five under construction totalling 394 MW. Both figures went out on 27 August. The gap between them is a fair measure of how provisional every damage number here is.
The named casualties among the operating plants, all in Rasuwa unless stated: the 111 MW Rasuwagadhi, 78 MW Salasungi Sanjen, 42.5 MW Sanjen, 14.8 MW Upper Sanjen, 14.8 MW Upper Mailung, 5 MW Mailung Khola, 20 MW Langtang and 22 MW Chilime. In Nuwakot: the 60 MW Upper Trishuli 3A, 24 MW Trishuli, 14 MW Devighat, the 25 MW solar project and a 220 kV substation. Under construction and severely affected: Upper Trishuli-1, Rasuwa-Bhotekoshi, Upper Mailung A, Upper Trishuli 3B and Middle Trishuli Ganga.
Electricity supply was completely halted in Rasuwa, with partial disruption in Nuwakot, Dhading and Gorkha.
The Rasuwagadhi plant is the sharpest detail in the list. Nepal Electricity Authority spokesperson Rajan Dhakal identified it as among the worst hit. The NEA had built it, watched it be devastated by the July 2025 flood, and had only recently returned it to full operation.
Petley has made the argument repeatedly and made it again: investments in large-scale hydropower in the Himalaya are being destroyed by exactly these catastrophic debris flows, and under climate-changed conditions many more such events will occur.
Ahmed and colleagues put the same point in regulatory language six months before this flood. Their charge is that environmental impact assessments for hydropower, roads and mountain tourism almost never account for cryosphere-specific risk, and that hazard assessments in glacier-fed valleys are not updated for permafrost degradation, newly forming lakes, or cascading process chains. Their recommendation was that cryosphere-specific hazard analyses become mandatory in EIAs, with exclusion zones that are scientifically justified and legally enforceable.
Did climate change cause the Nepal glacier collapse?
The climate framing is where honesty matters most, and where most coverage of this disaster has been sloppy in one direction or the other.
ICIMOD drew the line explicitly: warming is reshaping glaciers, snow, permafrost and slope stability across the Hindu Kush Himalaya, but the organisation says it is “too early to determine what role climate change played in this specific event.” Kristen Cook made the same distinction in fewer words: “It’s difficult to conclusively link a single event directly to climate change. We know it’s getting warmer in the Himalaya. Permafrost is melting. Things are becoming unstable.”
The conditioning trend, as opposed to the single-event attribution, is documented and directional. Two ICIMOD reports released on 21 March 2026 provide the current baseline:
- Ice-loss rates across the Hindu Kush Himalaya have doubled since 2000.
- Between 1990 and 2020, HKH glaciers lost about 12% of their total area and 9% of their estimated ice reserves.
- Total loss of up to 27 metres of ice thickness since 1975.
- The inventory covers more than 63,700 glaciers across nearly 55,782 km².
- Around 78% of that glacier area sits between 4,500 and 6,000 metres, the band most exposed to elevation-dependent warming. The Langtang collapse initiated inside that band.
The reports also expose the observational gap. The HKH Glacier Outlook 2026 synthesises data from 38 monitored glaciers, of which only seven meet the benchmark standards of the World Glacier Monitoring Service. Major glacierised regions including the Karakoram, Sikkim, Zanskar and Bhutan remain largely unmonitored. Cryosphere specialist Mohd. Farooq Azam described the situation as trying to navigate a rapidly changing future with an incomplete map.
ICIMOD’s Director General Pema Gyamtsho was blunter: “This isn’t a distant problem; it’s a crisis unfolding in real-time, with new disasters every summer and monsoon. The fact that ice loss rates have doubled this century should shock us all into action.”
The mechanism linking that trend to slope failure is well understood. High-mountain rock and ice are held together by permafrost. As the frozen bond thaws at progressively higher elevations, meltwater penetrates fractures that ice previously sealed, reducing friction and adding pressure. Remove the ice buttressing the base of a steep face and competent gneiss becomes an overhang waiting for a trigger.
Shugar was willing to state the probabilistic version without hedging, while separating it cleanly from single-event attribution. He said it is “100 percent” certain that climate change will make these events more likely “by some combination of glacier melt, permafrost thaw, and changes to precipitation and temperature patterns,” and then added the part that usually gets cut:
“Of course, one other very big factor is human activity. If an event like this happened in a valley with no people, we wouldn’t be having this conversation. But as humans increase our footprint… we will increase the severity of the disaster.”
Two trends are running at once: the slopes are becoming more likely to fail, and the valleys below them hold more people and more infrastructure every year.
The paper that warned about this, six months early
On 6 March 2026, Communications Earth & Environment published a Perspective by Rayees Ahmed, Anshuman Bhardwaj, Lydia Sam and Lander Van Tricht, titled “Ice-rock avalanches in a warming Himalaya indicate pathways toward effective preparedness.”
Its argument was that the difference between Chamoli’s catastrophe and Blatten’s near-escape was not luck but preparedness, monitoring and rapid response, and it asked why such preparedness remains rare in the Himalaya.
Three details give the paper an uncomfortable weight now.
It was received on 26 August 2025, one year to the day before the Langtang collapse.
One of its peer reviewers was Dan Shugar, the same scientist who would spend 26 and 27 August 2026 identifying the source scar from Planet imagery.
And among its references is an essay published in June 2025 by Austin Lord, an anthropologist at the Stimson Center who was in the Langtang Valley during the 2015 avalanche, titled “Blatten, Langtang, and Disasters Yet to Come?” Lord wrote that his friends in Langtang had spent ten years rebuilding their lives while wondering whether another event of that magnitude might be possible.
Ahmed and colleagues draw the contrast in terms of observability. At Blatten the accelerating deformation was visible from the village itself, directly above the houses, so residents’ own eyes supplemented the instruments. Chamoli initiated in a remote high-altitude zone nobody could see, with the infrastructure that died sitting many kilometres downstream rather than beneath the failing slope. Their conclusion:
“Blatten benefited from both instrumental monitoring and human observability, whereas Chamoli had neither.”
Langtang’s initiation zone offered neither, and the hazard chain crossed an international border on its way downstream.
Early warning: why Blatten evacuated and Langtang did not
Blatten had two things Langtang lacked, and neither of them was money.
The first was human observability. The accelerating slope sat directly above the village and in plain view of it. Residents reported unusual activity less than a week before the collapse. In the Himalaya, initiation zones are typically several thousand metres above and tens of kilometres away from the people at risk.
The second was institutional readiness. Switzerland’s Integrated Risk Management framework combines all-hazards assessment, integrated action planning and active involvement of authorities and communities at federal, cantonal and communal levels. When residents raised the alarm, cantonal and federal experts deployed radar interferometry, GPS stations and thermal and optical cameras within days, confirmed accelerating deformation, and issued the evacuation order. Local monitoring expertise in that valley had been building since destructive avalanches in 1993 and 1999.
Langtang’s initiation zone was a remote, high-altitude flank nobody was watching. Blatten’s slope announced itself for days; Langtang’s gave nothing until the mass was already moving.
Why Nepal’s flood gauges failed: the wrong instruments were watching
Conventional flood forecasting in Nepal relies on rain gauges and rising river levels. Both failed here, for different reasons.
There was no meteorological precursor. No extreme weather or exceptional rainfall was reported in the catchment before the collapse, so a rainfall-threshold system would have stayed silent by design.
And the river gauges were both too slow and too fragile. The wave outran them, and then it destroyed them. Several monitoring stations along the Trishuli were damaged or washed away. ICIMOD noted that the Galchhi station remained operational, which is the only reason the nine-metre figure exists at all. Cook told NBC News that every gauge upstream on the Trishuli was destroyed before it could transmit any data that the water was rising, so downstream officials could infer that something had gone wrong from the silence, but not how large the flood was.
GFZ has been making this structural argument for years: existing systems require instruments on lake margins or river banks, where they are easily destroyed during flood events, and almost all of the catastrophic Himalayan events of recent years have originated from sources not designated as dangerous.
What a seismic early-warning system would have bought at Langtang
The hazard that was detectable was the collapse itself, recorded worldwide within seconds.
The precedent is Cook et al., published in Science in 2021 with Hovius as senior author. Its first author is the same Kristen Cook whose stopwatch reconstruction of the Langtang flow front appears earlier in this article. She spent 2021 demonstrating that the warning was technically possible and 2026 timing the flood that arrived without one. Their conclusion: with the existing network, a seismic monitoring system could have detected all event phases from up to 100 kilometres away and provided downstream warnings within minutes of initiation. GFZ states the specific figure: up to 11 minutes of potential early warning for the locality where most fatalities occurred, a hydropower site under construction.
Applying the same logic to Langtang, using Cook’s timings:
- Gyirong Port: ~7.5 minutes from collapse to impact. Detection would have been fast. Getting a warning across an international border in seven minutes is the hard part.
- Syabrubesi: roughly 13 to 14 minutes. Enough to move people uphill, if a siren existed.
- Betrawati: about 45 minutes. Enough for a full evacuation.
- Galchhi and below: hours.
GFZ announced on 28 August that it is building a digital twin approach for early warning of high-mountain floods and mass movements, combining real-time seismic monitoring with weather, river and satellite observations, automated event detection and rapid physics- and data-driven modelling. It builds on the Helmholtz-funded D-TWINS project and on work by Hui Tang, Jens Turowski and Qi Zhou. Several components already exist as research prototypes; the stated next step is an end-to-end demonstrator tested through a Himalayan pilot.
GFZ lists five remaining obstacles, all of them engineering and institutional rather than scientific: instrument networks optimised for surface processes rather than solid-Earth seismology; autonomous, satellite-telemetered stations; automated identification of extreme floods, which requires a training library of historical events; rapid location and tracking of a moving flood front; and the last-mile problem of getting a warning to reach and activate local populations, authorities and hydropower operators.
The last mile is where Langtang failed hardest, and it is the one that cannot be solved by procurement. ICIMOD’s Neera Shrestha Pradhan made the point directly: providing information alone is not enough, because communities also need to know how to translate that information and act on it without panicking.
The transboundary dimension compounds it. Basanta Raj Adhikari of Tribhuvan University noted that the exposure and risk profile of downstream communities including Rasuwa and Betrawati is changing dramatically, and that real-time risk information needs to reach local decision-makers and translate into life-saving decisions. Cryosphere specialist Mohd. Farooq Azam framed the same failure as a governance one: today’s disaster in the Lhende Khola is another cause for regional collaboration, where governments should take joint, consolidated steps to react to cross-border hazards.
Not the first time: the Bhote Koshi in 2025, and Langtang in 2015
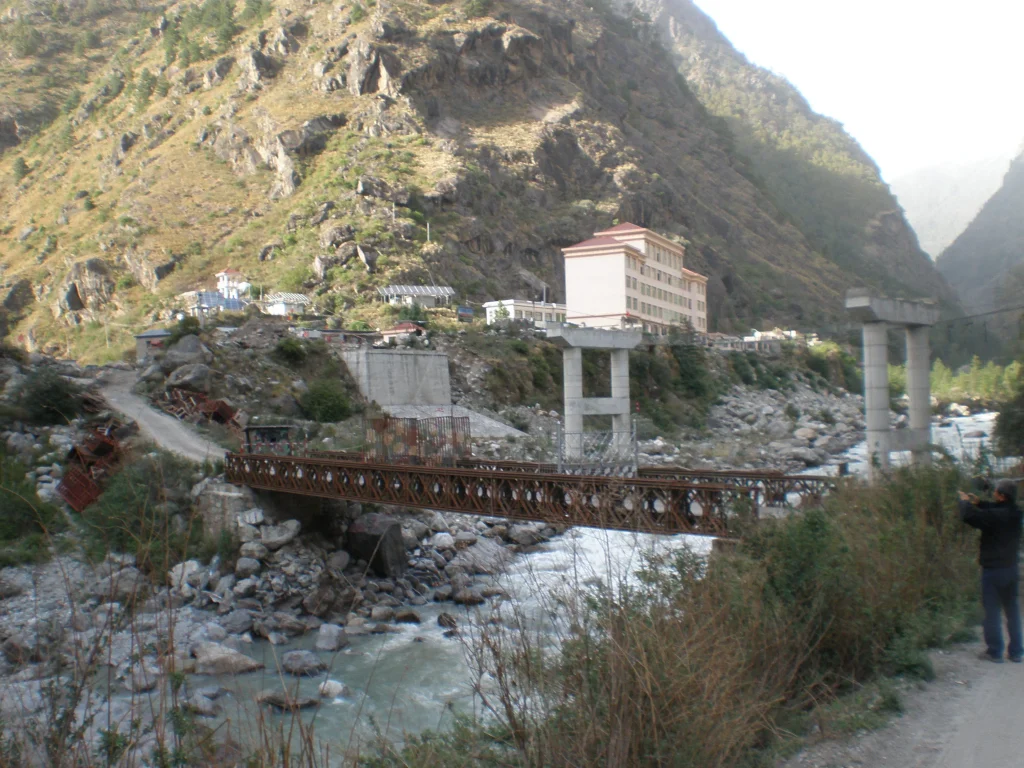
This valley has been rehearsing the disaster.
8 July 2025
Fourteen months earlier, a flood on the Lhende and Bhote Koshi swept down the same gorge at around 3:15 a.m. ICIMOD’s satellite analysis later attributed it to the drainage of a supraglacial lake in Tibet, about 36 km north of the border at Rasuwagadhi and at roughly 5,150 m elevation, not to rainfall. It killed at least nine people and left 19 or 20 missing, including six Chinese nationals and several security personnel. It carried away the Miteri (Friendship) Bridge at the border, damaged the Rasuwagadhi dry port, swept away sections of the Syabrubesi–Rasuwagadhi road, and knocked out hydropower capacity supplying at least 211 MW to the national grid, including the Rasuwagadhi plant destroyed again in 2026. It also took away 23 cargo containers, six freight trucks and 35 electric vehicles waiting at the border.
ICIMOD’s Qianggong Zhang, Head of Climate and Environmental Risks, made the continuity explicit on the day of the 2026 flood: “The same site devastated by last year’s Rasuwa flood is once again under threat.”
Sanyal put the recurrence interval in the plainest possible terms: the Lhende Khola has flooded twice in fourteen months.
Two events, fourteen months apart, different mechanisms, the same gorge. Neither arrived with usable warning.
April 2015
The Gorkha earthquake triggered a co-seismic avalanche in the adjacent Langtang Khola drainage that buried Langtang village. The USGS notes it came off the same mountain: several million cubic metres of ice and debris starting at 5,000 metres elevation and falling nearly 1,900 metres, burying a village and killing more than 200. Later reconciliations put the toll above 300.
The 2015 event has an epistemic footnote that bears directly on 2026. Lord noted that formal scientific recognition of the role climate volatility played in the Langtang disaster took almost ten years, partly because the avalanche was seismically triggered and the earthquake signal overshadowed the climate one. Many Langtangpa had made the connection immediately.
Three events off or beside one mountain in eleven years: a co-seismic avalanche in 2015, a supraglacial lake outburst in 2025, and an ice-rock avalanche in 2026.
What scientists still don’t know about the Langtang collapse
Three days in, these are the open questions.
- The failure mechanism. Pure glacier collapse, or a bedrock landslide that entrained the glacier? The USGS explicitly declines to choose. Shugar leans bedrock-dominant. Steiner describes a glacier tongue shearing off because the rock beneath it failed. GFZ describes a hanging glacier and underlying bedrock. Unresolved until field or high-resolution elevation work partitions the mass.
- The source volume. No peer-reviewed estimate exists. Cook told Scientific American that initial seismic analysis implied hundreds of millions of tons of rock, ice and other debris collapsed, and called the scale “really shocking.” Shugar’s assessment remains “we don’t know exactly how big yet but big.” Neither number has been published or independently checked.
- Source elevation and fall height. Reported values span 1,200 m (Copernicus EMS) to about 2,100 m (Steiner, 5,100 m down to 3,000 m). A near two-fold spread in the single number that sets the event’s energy budget.
- The water budget. How much of the flood water came from flash-melted ice, from entrained saturated sediment and from river flow is unquantified. Petley flagged his own reconstruction openly as speculation.
- The dam-and-breach question. Steiner’s account has the mass damming a river and the flood following the breach. Others describe a more continuous debris flow. Whether the wave that hit Gyirong was primarily a direct debris flow or primarily a dam-break surge changes the hydrograph and the hazard model.
- The second seismic event. Whether us7000tc90 was a second slope failure, a dam-break pulse or a large secondary collapse is not established.
- The barrier lakes. Volume, stability and future behaviour of both transient dams remain a live, evolving hazard rather than a settled fact, and the upstream lake was still growing.
- Pre-failure deformation. Nobody has yet reported a systematic search of the Sentinel-2 or InSAR archive for slow motion on the north flank before 26 August. At Chamoli, thermal anomalies, widening fractures and progressive slope deformation were evident for months to years beforehand in the imagery. They were not detected or acted on, not only because no warning system existed, Ahmed and colleagues note, but because such signals are hard to separate from background noise.
- Climate attribution. The conditioning role of warming and permafrost thaw is well supported at the regional scale. Formal single-event attribution has not been done and, ICIMOD cautions, is premature.
- The counts. Every casualty and damage figure here is provisional to the morning of 29 August 2026, and unreconciled between agencies.
Frequently asked questions
Was the Nepal flood caused by an earthquake?
No. It was initially reported as a magnitude 4.4 earthquake, but the USGS reanalysed the long-period seismic waves and concluded that the seismic energy was generated by a glacial collapse and debris flow rather than by fault rupture. The catalogue now lists the event type as “landslide.”
What is a glacier collapse?
The sudden detachment of a large mass of glacier ice, often together with the bedrock beneath it, from a steep high slope. The mass falls, fragments, and can flash-melt from frictional heat into a fast, water-charged debris flow that travels far beyond the reach of a normal rockfall.
Is this a glacial lake outburst flood (GLOF)?
Most likely not. A GLOF is the drainage of a glacier-fed lake after its dam fails, as at South Lhonak in Sikkim in 2023. The leading interpretation here is an ice-rock avalanche that generated its own water and dammed a river, rather than draining a pre-existing lake. Petley wrote that there is no evidence this was a GLOF. A GLOF contribution has not been formally excluded.
Did climate change cause it?
No single collapse can be pinned on warming with certainty, and ICIMOD says it is too early to attribute this specific event. The conditioning trend is well documented: ICIMOD finds Hindu Kush Himalaya ice-loss rates have doubled since 2000, with about 12% of glacier area and 9% of ice reserves lost between 1990 and 2020, and 78% of the region’s glacier area sitting in the elevation band most exposed to warming. Warming-driven retreat and permafrost thaw increase the conditions that make such failures more likely.
How many people died?
Provisional and disputed as of the evening of 28 August 2026. Nepal’s NDRRMA gave 579 dead and 1,924 missing in its 7 p.m. bulletin; Nepal Police were counting 547 separately at 3 p.m. that day; by the morning of 29 August the aggregate toll had risen to at least 626 dead, with close to 3,000 people missing across Nepal and Gyirong County combined. On the Tibetan side, reported figures range from 5 to 7 dead with 554 to 558 missing. All figures are rising and none have been reconciled.
Why were so many of the missing foreigners?
The Rasuwagadhi–Gyirong crossing is the main overland gateway for the Kailash Mansarovar pilgrimage and late August is peak season. Of the 1,924 people listed as missing in Nepal, 517 were foreign nationals, from at least 32 countries. A further 933 were linked to hydroelectric project sites.
Is the Langtang trek still open?
The Langtang Valley trail itself, east of Syabrubesi, was not in the flood path. Its access route was. Syabrubesi, Timure and Betrawati were all struck and the Betrawati–Rasuwagadhi road was severely damaged with bridges swept away. Check with operators and official sources before travelling, and expect the situation to change.
Could it happen again?
Yes, and one upstream barrier lake was still growing days after the event. This corridor flooded in July 2025 and the adjacent Langtang Khola was buried by a co-seismic avalanche in 2015. Steiner noted that material remains up on the glacier, as do lakes further down, making this a developing situation with the potential for recurrent events. Thousands of comparable high, steep, ice-loaded slopes exist across the region and almost none are monitored.
Where are the Bhote Koshi and Trishuli?
The Bhote Koshi enters Nepal from Tibet through the Rasuwagadhi–Gyirong border gorge in Rasuwa district, north of Kathmandu, fed near the frontier by the Lhende Khola. It becomes the Trishuli, which flows about 100 km south through Nuwakot and Dhading toward Chitwan. The flood ran this corridor, not the neighbouring Langtang Khola, and not the larger river of the same name 65 km to the east.