


Introduction
In June 2024, a team led by Wei Wang and John Vidale of USC published a result that overturned three decades of seismological assumption. By matching seismograms from earthquakes that recurred at the same patches of the South Sandwich Islands between 1991 and 2023, all recorded at arrays in northern Canada and Alaska, they showed that Earth’s inner core had reversed its drift relative to the planet’s surface. Waveforms from 2023 events lined up with traces from before 2008, as if a tape had been rewound.
Vidale’s first reaction made it into the USC press release: “When I first saw the seismograms that hinted at this change, I was stumped,” he told the USC Dornsife press office on 12 June 2024, the day the paper went live in Nature. The matching waveforms meant that Earth’s solid inner core, a sphere of iron and nickel roughly 70 percent the diameter of the Moon, had reversed its differential rotation. After decades of running slightly faster than the planet’s surface, it had begun to lag.
The result, published as Wang, Vidale, Pang, Koper, and Wang (2024) in Nature, is one of the cleanest measurements ever made of a region no instrument can reach. The inner core sits 5,150 km below the surface at pressures of 330–360 gigapascals and temperatures comparable to the visible surface of the Sun. The only way to study it is to record seismic waves that pass through it, and the records show that the deepest part of Earth has reversed its drift relative to the mantle.
Earth’s Inner Core: Size, Composition, and Conditions
At the geometric center of Earth, beneath the crust, mantle, and liquid outer core, sits the inner core. The inner core has a radius of about 1,221 km, which puts its diameter at roughly 2,442 km. That is about 70 percent the diameter of the Moon (3,474 km), packed into the geometric center of a planet 12,742 km across. It is enclosed by the liquid outer core (about 2,260 km thick), which is enclosed by the rocky mantle and a thin crust at the surface.
The pressure at the inner-core boundary is around 330 gigapascals, climbing to roughly 360 GPa at the center. That is more than three million times the pressure of the air at sea level. Alfè (2009) estimated the temperature at the inner-core boundary at about 5,400 K, comparable to the Sun’s visible surface. Laboratory measurements vary: experimental work in the 2010s pushed melting-point estimates as high as 6,230 ± 500 K. Iron stays solid here because the pressure is enormous, even at temperatures that would vaporize it at the surface.
The conventional model since the 1980s has iron crystallizing in the hexagonal close-packed phase (ε-iron), in which atoms stack in the densest possible layered arrangement. Diamond-anvil experiments by Rostislav Hrubiak, Yue Meng, and Guoyin Shen, published in 2018, found evidence that iron may instead adopt a body-centered cubic phase at the highest inner-core temperatures. The phase question remains open. The solid state and the seismic anisotropy are not contested. P-waves travel faster along the spin axis than across the equator, and iron continues to crystallize onto the inner core from the liquid outer core above.
This solid ball is suspended inside the liquid outer core and held in place by gravity. Because it is decoupled from the mantle by liquid, it is free in principle to rotate at a different rate.
Inge Lehmann and the 1936 Discovery
Inge Lehmann was born in Copenhagen in 1888 and trained as a mathematician at the University of Copenhagen and briefly at Newnham College, Cambridge. In 1928 she was appointed head of the seismological department of the Royal Danish Geodetic Institute, a position she would hold until 1953. The institute operated seismographic stations in Copenhagen and Greenland; Lehmann supervised them, interpreted the records, and corresponded with seismologists across Europe and the United States. For most of those years she was the only seismologist in Denmark.

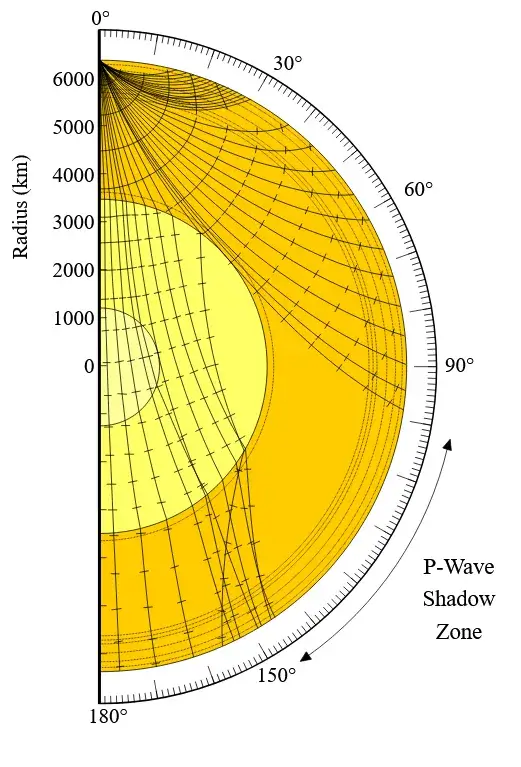
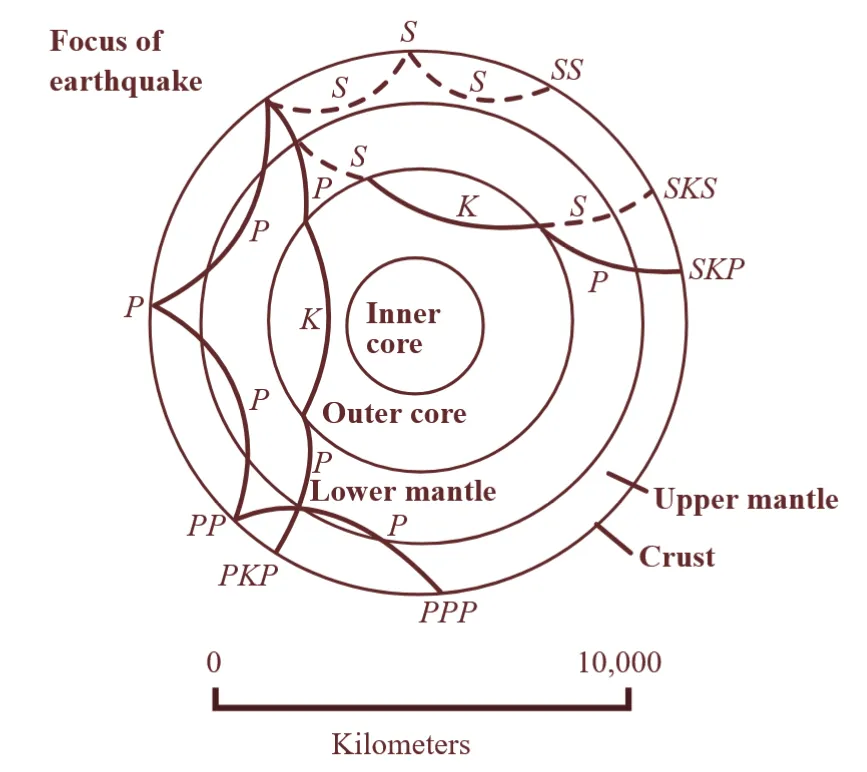
The puzzle she focused on came from the magnitude 7.8 Murchison earthquake on New Zealand’s South Island, 16 June 1929 (UTC). P-waves, the fastest pressure waves released by a quake, should arrive within a known time window across the globe. Beyond a certain angular distance from the epicenter, they fall into a “shadow zone” where the liquid outer core bends them away. Yet faint P-wave arrivals were being detected inside the shadow zone, where no waves were supposed to reach. The accepted picture of a single molten core could not explain them.
Lehmann’s idea was to put another layer inside the outer core: a smaller, solid sphere at the very center, dense enough to refract P-waves back outward and bend them into the shadow zone. She published the proposal in 1936 in Publications du Bureau Central Séismologique International, Série A, Travaux Scientifiques 14, pages 87–115. The paper carried one of the shortest titles of any milestone paper in seismology: “P′.” The prime denoted the P-waves that crossed from mantle into core.
Within a few years, Harold Jeffreys, Beno Gutenberg, and Charles Richter confirmed her interpretation. Gutenberg and Richter calculated an inner-core radius near 1,200 km, very close to the modern value. Lehmann’s status at home stayed modest for decades. She received an honorary doctorate from Columbia University in 1964, election as a Fellow of the Royal Society in 1969, the William Bowie Medal in 1971 (as the first woman), and the Medal of the Seismological Society of America in 1977. She published her last paper at 99 and died in 1993 at 104. Every textbook diagram of Earth’s interior with its concentric layers descends from her 1936 argument about wave paths.
Does Earth’s Inner Core Rotate? Three Decades of Debate
Lehmann’s solid sphere was treated for sixty years as a static feature, locked to the rest of the planet’s rotation. Then, in July 1996, Xiaodong Song and Paul Richards of Lamont-Doherty Earth Observatory published a short paper in Nature titled “Seismological evidence for differential rotation of the Earth’s inner core.” Their argument used the same source-receiver geometry that would dominate the field for the next thirty years: earthquakes in the South Sandwich Islands, recorded in Alaska.
By comparing the travel times of PKIKP waves (which cut through the inner core) and PKP waves (which skim through the outer core only) across three decades of records, Song and Richards inferred that the inner core was rotating about one degree per year faster than the mantle and crust. The image of a ‘planet within a planet’ rotating independently drew wide media coverage and decades of follow-up studies.
The rate did not survive contact with later data. Through the late 1990s and 2000s, estimates fell. Annie Souriau’s group in Toulouse attributed much of the apparent drift to hypocenter mislocations. Kenneth Creager at the University of Washington pulled the rate down to roughly 0.2° per year. Jian Zhang and colleagues, using earthquake doublets, refined it further. As Yang and Song summarized in a 2020 paper in Journal of Geophysical Research: Solid Earth, “a rotation rate of about 0.05–0.1° per year with possible decadal fluctuation can reconcile all temporal change observations from body waves, IC scattering, and normal mode data.” Some researchers, like Lianxing Wen at Stony Brook, argued the inner core was not rotating at all and that the observed seismic changes came from a shifting, irregular boundary instead.
Then in January 2023, Yi Yang and Xiaodong Song reopened the question from the other end of the timescale. Their paper in Nature Geoscience, “Multidecadal variation of the Earth’s inner-core rotation,” gathered records back to 1964 and showed that PKIKP wave paths which had been changing steadily for decades had abruptly gone quiet. Differential inner-core rotation, they argued, “has recently paused.” More striking, the recent pattern appeared to be part of a long-period oscillation of roughly 70 years, with a previous turning point in the early 1970s and another around 2009–2010. The 70-year period was suspiciously close to known oscillations in the length of day and in Earth’s magnetic field, hints of a deeper coupling between layers.
Yang and Song’s claim was controversial. Wen and his collaborator Daoyuan Tian responded with a sharp critique in Geophysical Research Letters in 2023, arguing that the data were just as well explained by localized changes in the inner-core boundary itself rather than by a whole-body rotation reversal. Hrvoje Tkalčić of the Australian National University, who has spent his career studying the inner core, told Science News in 2024 that ‘it is very likely the truth is somewhere in between.’ Wang and Vidale were already at work on a more direct test.
The 2024 Nature Paper: How Wang and Vidale Tracked the Reversal
The 2024 paper rests on seismograms from two short-period, medium-aperture arrays in northern North America: the Eielson array (ILAR) outside Fairbanks, Alaska, and the Yellowknife array (YKA) in the Canadian Northwest Territories. Yellowknife was installed in 1962 under a joint program between the Canadian Department of Mines and Technical Surveys and the United Kingdom Atomic Energy Authority to detect underground nuclear tests. Eielson has played a similar role for the U.S. seismic verification network. Both arrays sit roughly antipodal to the South Sandwich Islands earthquake zone, on a north-south path that has been shown to be especially sensitive to motions of the inner core.

How Repeating Earthquakes Work as Probes
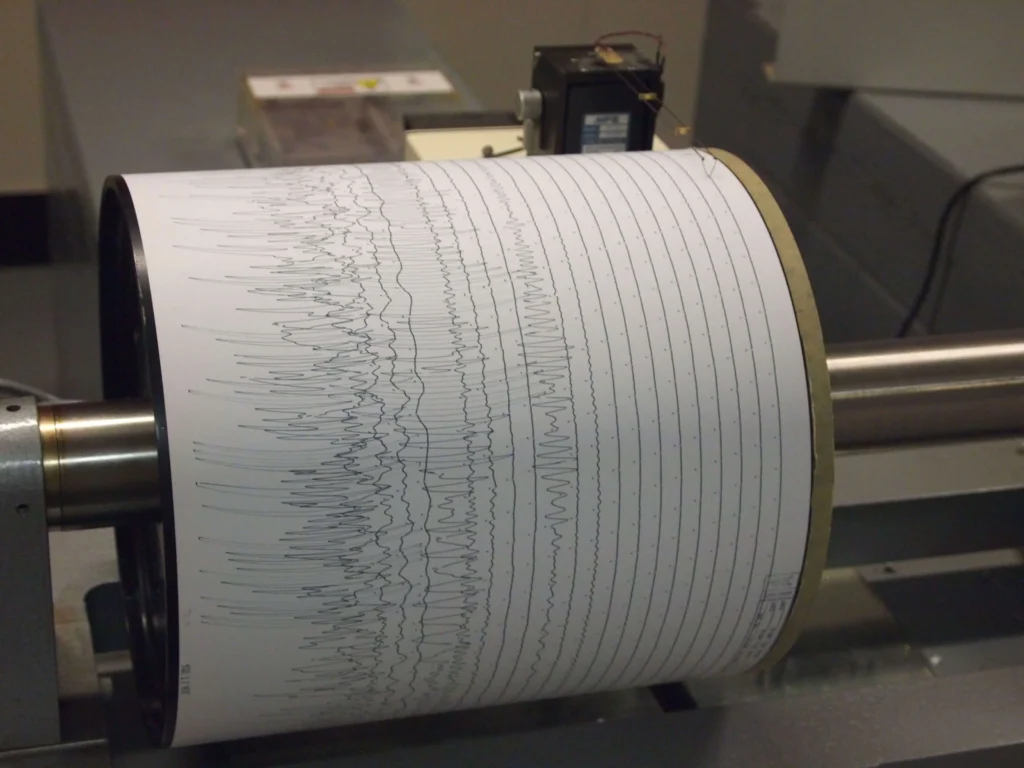
The trick that makes this measurement possible is the repeating earthquake. Most quakes happen on faults that move incrementally; sometimes the same patch slips again years later, in nearly the same place, with nearly the same rupture geometry. The resulting seismograms recorded at a distant station look almost identical at high frequencies. Any difference between the traces, then, has to come from changes along the wave path itself, not from the source.
Two earthquakes at the same spot, decades apart, should produce nearly identical traces at a distant station, unless something along the wave path has changed. If 2015 traces disagree with 1995 traces but 2023 traces agree again, then whatever moved has moved back.
Why Earthquakes in the South Sandwich Islands Are the Key Probe
The South Sandwich Islands are a chain of small volcanic islands above a subduction zone in the South Atlantic, between South America and Antarctica. The arc is one of the most seismically prolific patches of remote ocean on the planet, with shallow-to-intermediate-depth earthquakes recurring along the same fault patches over decades. A wave leaving this region going almost due north on a steep angle passes through the inner core and surfaces in northern Canada or Alaska. That geometry was identified by Song and Richards in 1996 as ideal for measuring inner-core motion, and the literature has used it ever since.
Wang, Vidale, Guanning Pang of Cornell, Keith Koper of the University of Utah, and Ruoyan Wang of USC compiled 121 earthquakes from 1991 to 2023 in the South Sandwich Islands, organized into 143 distinct pairs and 16 multiplets (groups of three or more events at the same source patch). All were recorded at both ILAR and YKA, with beamforming used to lift PKIKP signals out of background noise.
How the Waveforms Reveal a Rotation Reversal in 2008
The dataset breaks into three phases. From the early 1990s through about 2003, waveforms drifted slowly: PKIKP rays were sampling slightly different parts of the inner-core fabric on each pass. From 2003 to 2008 the drift accelerated, the signature of faster super-rotation. After 2008 the drift reversed: pairs that had been growing more dissimilar began to converge again, and by the early 2020s, post-2018 events were matching traces from before 2008.
The paper’s central finding, in the authors’ own words, is that “the inner core gradually super-rotated from 2003 to 2008, and then from 2008 to 2023 sub-rotated two to three times more slowly back through the same path.” The team places the reversal at 2008.5 ± 0.18 and estimates the post-reversal rate at roughly 2.5 times slower than the pre-2008 super-rotation. From 2010 onward the inner core has been moving slowly westward relative to the mantle, at roughly 40 percent of the eastward speed it had been carrying five years earlier.
“But when we found two dozen more observations signaling the same pattern, the result was inescapable,” Vidale told USC’s press office. “The inner core had slowed down for the first time in many decades.” The match between late-2010s and mid-1990s waveforms is the strongest single line of evidence that the inner core is undergoing rigid-body motion, not only boundary deformation, and that the motion has reversed sign.
The 2025 Follow-Up: Why the Inner Core’s Surface May Deform
Eight months later, the same team published a follow-up that complicated their own picture. On 10 February 2025, Vidale, Wang, Wang, Pang, and Koper published “Annual-scale variability in both the rotation rate and near surface of Earth’s inner core” in Nature Geoscience. They had extended the 2024 dataset and, crucially, compared seismograms recorded at moments when their own rotation model said the inner core had returned to the same orientation as years before.
If the inner core were a rigid ball and rotation alone explained the signal, those re-occupation pairs should have been identical. They were not, at one of the two arrays. At the Yellowknife array, which catches PKIKP rays that graze the upper part of the inner core, the team found waveform differences between 2004 and 2008 that had no rotational explanation. At Eielson, where the rays bottom out deeper inside the inner core, those same anomalies were absent. The signal was telling them that something near the inner core’s surface had changed shape independently of any spin.
The authors conclude that temporal variability in PKIKP waves arises from a combination of rotation and near-surface boundary deformation, rather than either alone. The shallow inner core, they argue, “most likely” undergoes viscous deformation driven by the turbulent liquid outer core dragging on it from below and by gravitational pulls from dense regions in the rocky mantle above. The inner-core boundary, in this picture, deforms on annual to decadal timescales, with regions rising or falling by up to a kilometer.
In a companion News & Views piece in the same issue (Nature Geoscience 18, 201–202), Hrvoje Tkalčić wrote that Earth’s wandering inner core has now been reliably tracked over the past 20 years, and that more is changing than just its position. The soft outermost shell of the inner core probably deforms as well. The outermost few kilometers may behave less like a rigid solid than like a high-pressure, high-viscosity fluid.
The Alternative View: Lianxing Wen’s Boundary-Deformation Model
Not everyone accepts the Wang and Vidale picture. The most persistent and credible dissent has come from Lianxing Wen at Stony Brook University. Wen has argued since at least 2006 that the entire pattern of changing PKIKP arrivals can be explained without invoking any solid-body rotation of the inner core. In a 2006 paper in Science, Wen showed that compressional waves from a South Sandwich earthquake doublet (events on 1 December 1993 and 6 September 2003), reflected off the inner-core boundary and recorded at stations in Russia and Kyrgyzstan, arrived 39 to 70 milliseconds earlier in 2003 than in 1993. He interpreted that as the inner core’s radius locally enlarging by about 0.98 to 1.75 kilometers beneath mid-Africa.
Wen’s model is internally consistent and physically plausible. The inner core grows by freezing iron from the liquid outer core onto its surface, which means its boundary really does shift, and need not shift uniformly. Wen’s view is that the apparent “rotation” signal is just the geographic pattern of those topography changes drifting through whatever ray paths happen to sample them. Asked about the Wang-Vidale 2024 dataset in coverage published by Science News, Wen acknowledged the data quality but maintained that surface topography changes alone can account for the observed waveform shifts without invoking solid-body rotation.
Vidale has been more measured in interviews. The 2025 paper effectively concedes a substantial role for boundary deformation, while keeping rotation as the dominant signal in the deeper-bottoming Eielson rays. “These are just completely orthogonal theories,” Vidale told Inverse, “and every theory has some data that contradicts it. That’s why I think there’s more going on than just one of these ideas alone.” Tkalčić, in his News & Views, declines to declare the dispute over.
What the Slowdown Does and Doesn’t Change
The headline ‘Earth’s core is reversing direction’ is technically defensible but easy to misread. Within a week of the 2024 paper, social media filled with claims that the slowdown would cause earthquakes, flip Earth’s magnetic field, lengthen the day by hours, or trigger climate disasters. None of this holds up. The authors do not claim it, and the physics does not support it.
Start with the length of day. Earth’s surface rotation is influenced by many things: tides, atmosphere, oceans, ice mass redistribution, mantle convection, and angular momentum exchange with the core. The inner core’s motion is one input, and a small one. Vidale’s estimate of the effect from the current backtracking is small. “It’s very hard to notice,” he told USC, “on the order of a thousandth of a second, almost lost in the noise of the churning oceans and atmosphere.” A millisecond per year is the rough scale. Climate-driven ice melt is a larger lever. Kiani Shahvandi et al. (2024, PNAS) report a climate-induced length-of-day trend that has accelerated since 2000 and may, under high-emission scenarios, exceed the long-known braking effect of lunar tidal friction (around 2.3 ms per century) by 2100.
The geomagnetic field is sometimes dragged into these stories too. The field is generated by convection in the liquid outer core, not by the solid inner core’s rotation. The inner core influences outer-core flow patterns over very long timescales, and the geodynamo certainly varies. The South Atlantic Anomaly, the weakened patch of the field over the southern Atlantic and South America, has expanded measurably over the past decade, according to NOAA’s World Magnetic Model updates and ESA’s Swarm satellite mission. The north magnetic pole has been drifting toward Siberia at several tens of kilometers per year, with the south magnetic pole moving more slowly. None of this hinges on the inner core’s recent backtracking. A geomagnetic reversal, when it eventually happens, will play out over thousands of years, and there is no evidence that the current slowdown is its trigger.
Climate change is not on the list at all. The inner core does not heat or cool the atmosphere on any human timescale. Heat flow out of the core into the mantle is estimated at roughly 5–15 terawatts (Lay, Hernlund & Buffett 2008, Nature Geoscience; subsequent mineral-physics work has narrowed but not settled the range), and is unaffected by the recent rotation reversal. The warming of the past 150 years is driven by greenhouse gas accumulation in the atmosphere.
The reversal does give geophysicists something new to work with: a measured rate ratio that future models of inner-core dynamics will have to match. The rate ratio Wang and Vidale measured, about 2.5 times slower going back than forward, is a constraint that future models of inner-core dynamics have to match. The asymmetry between super-rotation and sub-rotation, the 70-year oscillation Yang and Song proposed, and the shorter six-year oscillation seen in the length of day all point to a coupled system of inner core, outer core, and mantle that no one has fully written down.
How the Inner Core Couples to the Outer Core and Mantle
The inner core does not move on its own. It is dragged by two forces. From below, the liquid outer core convects in turbulent loops, with electromagnetic currents and viscous traction tugging on the inner core’s surface. From above, dense regions in the lower mantle, including the two continent-sized blobs known as large low-shear-velocity provinces (LLSVPs) under Africa and the Pacific, pull on the inner core through gravity. The inner core sits between these two engines, responding to both.
Yang and Song’s 2023 paper made the case that the rhythm of this response shows up as a roughly 70-year oscillation, coincident with similar-period variations in the length of day and the magnetic field. Wang and Vidale’s 2024 measurement, which catches a turning point near 2008, is consistent with that broader picture, though the team is careful to note that their data alone cannot decide between several possible long-period models. Pang and Koper, in earlier work using the same arrays, found a brief, rapid rotation episode in 2001–2003 that does not fit a simple sinusoid.
Tkalčić has argued separately that models built on a small number of well-sampled ray paths risk over-fitting, with apparent rotation signals sensitive to which doublets are included. His position, repeated in his 2025 News & Views, is that the inner core is plainly active but its precise behavior remains under-constrained by the available data.
The 2025 follow-up complicates the picture in a useful way. If the outermost few kilometers of the inner core deform viscously on annual timescales, then the inner-core boundary is itself a participant in this coupled engine, not just a passive surface. Outer-core turbulence may push topographic bumps up and down by hundreds of meters within years; mantle gravity may organize where those bumps live. The geodynamo, the slow growth of the inner core as iron freezes onto it, and the rhythm of length-of-day oscillations all share that boundary.
Where the discipline goes next is largely about more and better data. The Eielson-Yellowknife pair is the best-sampled corridor through the inner core, but it is one corridor. Ocean-bottom seismometers, denser arrays in the southern hemisphere, and improved repeating-earthquake catalogues from regions other than the South Sandwich Islands would let seismologists test whether the Wang-Vidale rotation model holds on independent paths. Machine-learning analysis of micro-seismicity may also expand the catalog of usable doublets by orders of magnitude. If the proposed 70-year oscillation is real, the inner core’s westward drift should speed up, then slow, then flip back to eastward within a few decades. That is a falsifiable prediction on a timescale future seismologists can test.
What Comes Next
Return to Wei Wang at his workstation. He is looking at two seismograms. One was recorded when George H.W. Bush was president. The other was recorded after a global pandemic. Between them lie thirty-two years of small earthquakes in the South Sandwich Islands and the cold seismometers outside Yellowknife and Fairbanks that recorded them. And a sphere of iron 2,442 km across, at 330 gigapascals, that has drifted somewhere and then drifted back.
The traces match. Which means that, by some path nobody has yet drawn precisely, the inner core has come back to where it used to be. The slowdown that began around 2010 is no longer a hypothesis from a single rate estimate. It is recorded, redundantly, in waveforms that overlay to within a fraction of a second across multiple decades.
This is a small finding by the standards of cosmology and a precise one by the standards of seismology. Daily life is unaffected. What changes is the constraint set future models of inner-core dynamics will have to match. Lehmann gave us the inner core in 1936. We are now ninety years into figuring out what it does.
“The dance of the inner core might be even more lively than we know so far,” Vidale told USC.
Frequently Asked Questions
Is Earth’s inner core actually moving backwards?
Relative to the mantle and crust above it, yes. The 2024 study by Wang, Vidale, and colleagues in Nature showed that between 2003 and 2008 the inner core was rotating slightly faster than the surface (super-rotation), and that since about 2008 it has been rotating slightly slower, drifting backwards through the same trajectory at about 2.5 times the slower rate of its previous super-rotation. In an absolute sense the inner core still spins eastward with the rest of the planet; it has simply fallen behind the mantle’s pace.
When did the inner core start slowing down?
The Wang and Vidale 2024 paper places the turning point at 2008.5 ± 0.18, with the slowdown becoming clearly resolvable around 2010. Yang and Song’s 2023 paper placed the most recent turning point around 2009–2010. The two estimates agree within their stated uncertainties. Different studies put the inflection anywhere between 2008 and 2010 depending on the dataset and method.
Does Earth’s core slowing affect the length of the day?
Marginally. Vidale’s estimate, given in the USC press release on 12 June 2024, is “on the order of a thousandth of a second, almost lost in the noise of the churning oceans and atmosphere.” Climate-driven ice melt is currently a larger contributor to length-of-day variation than the inner core’s recent slowdown, accelerating to 1.33 ± 0.03 ms per century since 2000 according to Kiani Shahvandi and colleagues in PNAS (2024).
Can the inner core’s slowdown affect climate change?
No. The inner core does not heat the atmosphere. Climate change is driven by greenhouse gases altering Earth’s radiative balance. Heat flow from the core to the mantle (roughly 5–15 terawatts depending on the mineral-physics estimate) is steady on human timescales and is not detectably altered by the recent rotation change.
How do scientists know what the inner core is doing without going there?
By comparing seismograms from repeating earthquakes. When two earthquakes happen at nearly the same spot years apart, the seismic waves they send through Earth follow nearly identical paths. Any difference between the recorded traces at a distant station reflects changes along the path. The 2024 study used 143 pairs of repeating earthquakes built from 121 events in the South Sandwich Islands, recorded at the Eielson (Alaska) and Yellowknife (Canada) arrays between 1991 and 2023, to track the inner core’s motion.
Will the inner core stop entirely?
No. The inner core is moving relative to the mantle, but it is firmly embedded in the planet’s overall rotation and will keep spinning eastward with Earth as a whole. The “stopping” sometimes described in headlines refers only to the small differential rate between the inner core and the surface, which has reversed sign and may oscillate over decades. There is no physical mechanism by which the inner core would come to absolute rest.
References
- Wang, W., Vidale, J. E., Pang, G., Koper, K. D., & Wang, R. (2024). Inner core backtracking by seismic waveform change reversals. Nature, 631(8020), 340–343. https://doi.org/10.1038/s41586-024-07536-4
- Vidale, J. E., Wang, W., Wang, R., Pang, G., & Koper, K. D. (2025). Annual-scale variability in both the rotation rate and near surface of Earth’s inner core. Nature Geoscience, 18(3), 267–272. https://doi.org/10.1038/s41561-025-01642-2
- Tkalčić, H. (2025). Earth’s inner core is changing in shape as well as in rotation rate. Nature Geoscience, 18(3), 201–202. https://doi.org/10.1038/s41561-025-01647-x
- Yang, Y., & Song, X. (2023). Multidecadal variation of the Earth’s inner-core rotation. Nature Geoscience, 16(2), 182–187. https://doi.org/10.1038/s41561-022-01112-z
- Yang, Y., & Song, X. (2020). Temporal changes of the inner core from globally distributed repeating earthquakes. Journal of Geophysical Research: Solid Earth, 125, e2019JB018652.
- Song, X., & Richards, P. G. (1996). Seismological evidence for differential rotation of the Earth’s inner core. Nature, 382(6588), 221–224. https://doi.org/10.1038/382221a0
- Wen, L. (2006). Localized temporal change of the Earth’s inner core boundary. Science, 314(5801), 967–970. https://doi.org/10.1126/science.1131692
- Lehmann, I. (1936). P′. Publications du Bureau Central Séismologique International, Série A, Travaux Scientifiques, 14, 87–115.
- University of Southern California (2024, June 12). USC study confirms the rotation of Earth’s inner core has slowed. USC Today. https://today.usc.edu/usc-study-confirms-the-rotation-of-earths-inner-core-has-slowed/
- Alfè, D. (2009). Temperature of the inner-core boundary of the Earth: Melting of iron at high pressure from first-principles coexistence simulations. Physical Review B, 79, 060101(R). https://doi.org/10.1103/PhysRevB.79.060101
- Hrubiak, R., Meng, Y., & Shen, G. (2018). Experimental evidence of a body centered cubic iron at the Earth’s core condition. arXiv:1804.05109.
- Kiani Shahvandi, M., Adhikari, S., Dumberry, M., Mishra, S., & Soja, B. (2024). The increasingly dominant role of climate change on length of day variations. PNAS, 121(30), e2406930121. https://pubmed.ncbi.nlm.nih.gov/39008671/
- NOAA National Centers for Environmental Information (2025). 2025 World Magnetic Model Annual Report.