

How a CCTV clip from the 2025 Mandalay earthquake rewrote seismology
The afternoon of 28 March 2025, the day of the Mandalay earthquake, was bright and pitiless in central Myanmar. At a 30-megawatt photovoltaic plant in the village of Tha Pyay Wa (also transliterated Thapyaywa), in Thazi Township, the solar panels were absorbing the kind of heat that softens asphalt: central Myanmar in the last week of March is regularly above 38°C. A security camera mounted near the gatehouse of the GP Energy Myanmar facility was doing what security cameras do, which is to say almost nothing. It looked southwest, across a concrete driveway, a sliding metal gate, a low rise of dry grass, and a line of distant hills. About twenty metres beyond the gate, invisible to the lens, ran the Sagaing Fault, a 1,400-kilometre crack in Earth’s crust that had not produced a major rupture along this particular segment since 1839.
At 12:50:52 Myanmar Standard Time, 06:20:52 UTC, that changed.
The first few seconds of the clip look like nothing. Then the gate begins to chatter against its frame. A bird launches from the foreground. A transmission tower in the middle distance starts to lean, slowly, the way a drunk leans on a wall. Around 14 seconds into the 26-second clip, a fissure rips diagonally across the driveway, opens into a metre-wide mole track, the mounded, soft-edged surface expression strike-slip ruptures leave in unconsolidated soil, and the right half of the world slides forward.
For 1.3 seconds, the ground on the western side of the fault hurtles north past the camera at peak velocities of roughly 3.2 metres per second: about 11.5 kilometres an hour, but applied to several cubic kilometres of crust. By the time the pulse passes, the two sides of the fault have shifted laterally by 2.5 metres. A small linear hill in the background, the kind of feature a geomorphologist would call a shutter ridge, formed by lateral displacement of older landscape across the fault, has lurched bodily toward the lens. The gate, now uncoupled from its post, swings open onto a landscape that no longer matches the one it was built to face. An aftershock follows seconds later; the gate vibrates again. The camera keeps recording.
No one outside the solar farm saw the file for six weeks. Then, on 11 May 2025, a Singaporean engineer named Htin Aung posted it to Facebook. A YouTube account called “2025 Sagaing Earthquake Archive”, an anonymous curator that had been collecting CCTV and phone footage from across Myanmar since the day of the quake, picked it up and republished it the same day under the title “First fault rupture ever filmed: M7.9 surface rupture filmed near Thazi, Myanmar.” Within a week, the clip was on the desks of every earthquake scientist with an internet connection.
What they were watching was not a curiosity. It was the first time in the history of seismology that the surface trace of a great earthquake had been recorded in motion by a calibrated, stationary instrument: even if that instrument was, technically, a cheap outdoor surveillance cam.
Why no one had ever filmed a fault rupture before
Surface ruptures are not new. The 1906 San Francisco earthquake left split fences and shifted roads across San Mateo County that became the founding photographs of fault geology. The 2002 Denali earthquake offset curbs and the Trans-Alaska Pipeline. The 2023 Kahramanmaraş doublet in Türkiye sliced through roads, olive groves, and a soccer pitch with such geometric precision that the aerial drone footage looked CGI-rendered.
But every one of those photographs was taken after the fact. The crust split, the surveyors arrived, the cameras rolled. The motion itself, the actual passage of the rupture front through the upper few hundred metres of soil, had only ever been inferred. Seismologists had decades of waveform data, GPS time series, satellite radar interferograms, and slickenline scratch marks on exhumed fault surfaces. They had laboratory analogues in plexiglas blocks and gelatin slabs. They had numerical models of growing sophistication. What they did not have was a video of a great fault going off.
Rick Aster, a geophysicist at Colorado State University, told Live Science within days of the clip surfacing that this was “the best video we have of a throughgoing surface rupture of a very large earthquake”, and predicted that a publication would follow as soon as the location could be confirmed.
Within five months, three independent peer-reviewed papers had appeared.
Wendy Bohon, an earthquake geologist and branch chief of seismic hazards and earthquake engineering at the California Geological Survey, put the reaction more bluntly to CBC News: “My jaw hit the floor.” Bohon catalogued small details that argued the clip was genuine: a bird flying off the moment shaking began, power lines straining and snapping, the asymmetric collapse of a transmission tower, and, in the deeper background, a small linear hill cut sharply where it met the fault — the kind of geomorphic signature no AI model would have known to generate. Lab and computer models of fault rupture exist, she told CBC, “but all of those are far less complex than the actual natural system.” Seeing one in motion, she said, was “mind-blowing.”
Judith Hubbard, a visiting assistant professor at Cornell’s Department of Earth and Atmospheric Sciences and co-author of the widely read Earthquake Insights newsletter, said the same thing more quietly. “I keep going back and watching it,” she told CBC. For someone who had spent years inferring fault slip from post-event offsets and distant seismometers, seeing a fault slide in real time was, she said, “kind of staggering.”
The remarkable thing is not just that the clip exists. It is that the clip exists at exactly the place a seismologist would have chosen, had any seismologist been allowed to choose.
The Sagaing Fault, in 1,400 kilometres and 186 years
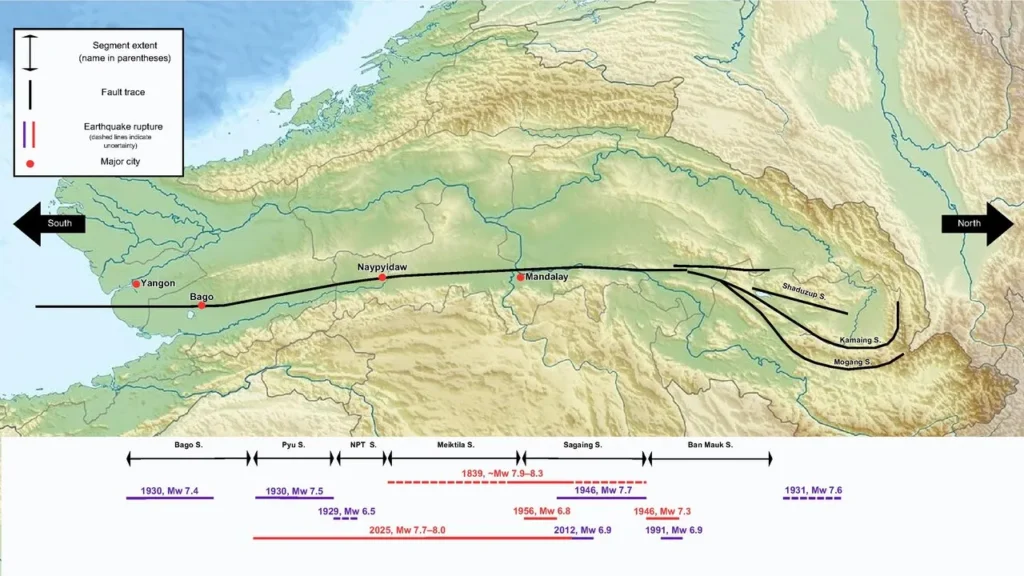
The Sagaing Fault is the spine of Myanmar in a literal sense. It runs almost dead north–south from the Andaman spreading centre offshore to the Eastern Himalayan syntaxis in the north, threading through or past every major Burmese city, Yangon, Naypyidaw, Mandalay, Sagaing itself, and forming the boundary between two minor tectonic plates: the Burma microplate to the west, riding above the obliquely subducting Indian Plate, and the Sunda Plate to the east. It is right-lateral, meaning if you stand on one side and look across, the other side is moving to your right. It is, in geological architecture, a near-twin of the San Andreas.
How fast is it moving? In 2022, Tha Zin Htet Tin and colleagues at Kyoto University and the University of Yangon published the first dense GNSS measurements of the central and southern Sagaing in the Journal of Asian Earth Sciences. They resolved slip rates of 23–24 mm/yr on the Sagaing and Meiktila segments and a slower 16 mm/yr on the southernmost Bago segment, with locking depths of 10, 16, and 10 km respectively. They concluded that the Meiktila segment, unruptured since the 19th century, presented the greatest seismic hazard along the central Sagaing.
That conclusion was not original to them. In 2011, Nobuo Hurukawa of the Building Research Institute in Tsukuba and Phyo Maung Maung of Myanmar’s Department of Meteorology and Hydrology in Nay Pyi Taw had relocated six M ≥ 7.0 earthquakes near the Sagaing Fault since 1918 and pointed to two persistent seismic gaps along its length: one between roughly 19.2°N and 21.5°N in central Myanmar (about 260 km long, with a forecast magnitude of M ~7.9), and another south of 16.6°N in the Andaman Sea. They published the result in Geophysical Research Letters. The central gap, the Meiktila gap, named for the small city it crosses, had last failed in 1839, in what historians of seismology call the Ava earthquake, with an estimated magnitude near 7.9. Naypyidaw, the purpose-built Burmese capital established in 2005, sits on top of this gap.
The other historical earthquakes on the fault read like a metronome: M 7.3 in May 1930, M 7.5 in December 1930 (the Pyu event), M 7.5 in 1931, a doublet of M 7.3 and M 7.7 in 1946, M 7.1 in 1956, M 6.8 near Thabeikkyin in 2012. Each one had broken a particular segment and left the Meiktila section alone. By 2024, the fault between roughly 19°N and 22°N had been silent for 186 years, with about 4 metres of slip deficit accumulated at a 23-mm/yr loading rate. Hurukawa and Maung Maung’s gap was, in the language of probabilistic seismic hazard analysis, ripe.
It went off on 28 March 2025. And it kept going.
The 475-kilometre rupture
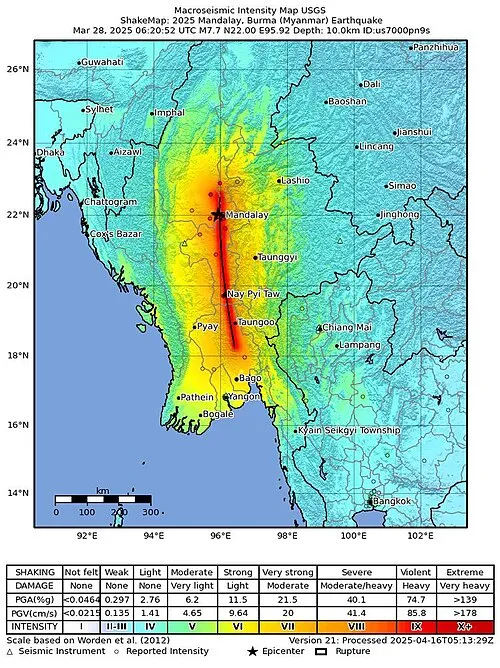
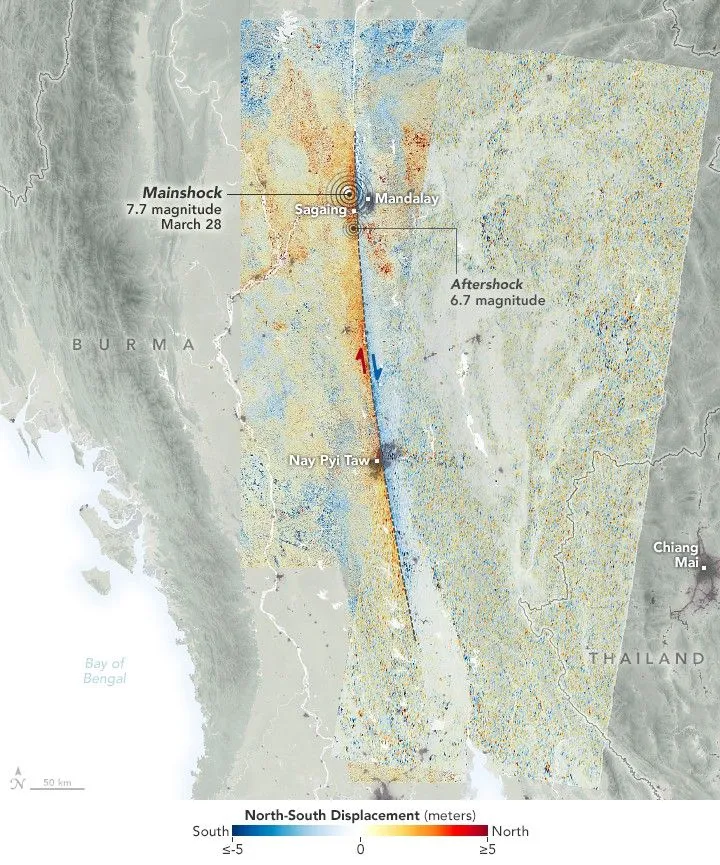
The earthquake initiated at 22.001°N, 95.925°E, at a depth of 10 km, about 17 km west-northwest of Sagaing city and 17 km north-northwest of Mandalay. The USGS event page (us7000pn9s) lists the moment magnitude at 7.7; the China Earthquake Administration and the Institut de Physique du Globe de Paris both put it slightly higher, at 7.8–7.9. Eleven minutes later, a Mw 6.7 aftershock failed about 30 km south of the mainshock epicentre, near Mandalay International Airport. PAGER estimated 415,000 people were exposed to Modified Mercalli Intensity X shaking and another 5.8 million to MMI IX. Roughly 70% of Myanmar’s population, across 14 of 15 administrative divisions, felt at least MMI VI.
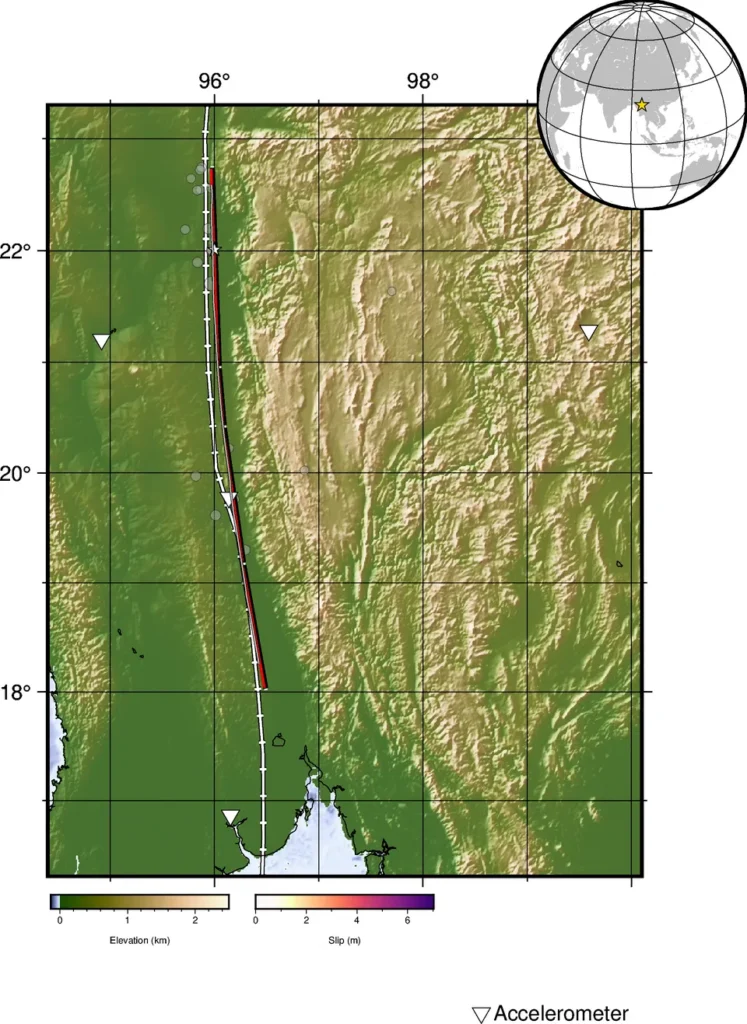
In Science on 30 October 2025, Dara Goldberg of the USGS Geologic Hazards Science Center in Golden, Colorado, and her colleagues, including William Yeck, Nadine Reitman, James Atterholt, and the rapid-response cadre that runs the National Earthquake Information Center, published the most-cited number from the event: the rupture broke 475 kilometres of the central Sagaing Fault, bilaterally. About 75 km of the rupture propagated north from the hypocentre, terminating just south of the rupture patch from the 2012 Mw 6.8 Thabeikkyin earthquake. The remaining ~400 km tore south, all the way to the Bago Region near Pyu. Average right-lateral surface offset was 3.3 m; maximum offset, mapped from sub-pixel correlation of Sentinel-2 and Planet Dove optical images by Reitman and colleagues at the USGS, was 5.6 m. NASA’s Advanced Rapid Imaging and Analysis (ARIA) team at the Jet Propulsion Laboratory, processing Sentinel-1A radar and Sentinel-2B/C optical data, estimated that some segments shifted by more than 6 metres.
The headline of Goldberg et al.’s paper is not the length, however; it is the word “ultralong.” The paper’s title, “Ultralong, supershear rupture of the 2025 Mw 7.7 Mandalay earthquake reveals unaccounted risk”, buries the punchline in the second clause. Magnitude-length scaling relations, the empirical curves used in essentially every probabilistic seismic hazard map on Earth, predict a rupture of 100 to 300 km for a Mw 7.7 strike-slip earthquake. The Mandalay rupture was 1.6 to 4.7 times that. It is the longest continental strike-slip rupture ever instrumentally recorded.
Existing probabilistic seismic hazard analyses, Goldberg and her co-authors write, “use scaling relations that do not account for such long ruptures at moderate magnitudes” — a limitation that, combined with the broader population and infrastructure exposure ultralong ruptures imply, leaves seismic risk systematically mischaracterised.
In other words: the building codes are calibrated to an earthquake that doesn’t exist.
What supershear means in an earthquake
The other reason the rupture was so destructive was that, for most of its southward run, it was moving faster than the seismic waves it was producing.
To understand why this matters, picture an ordinary earthquake the way seismologists usually do: as a crack on a fault plane that begins at the hypocentre and unzips outward at some velocity. Most earthquake ruptures travel at 70–90% of the local shear-wave speed, typically around 2.5–3.5 km/s in the upper crust. The shear waves themselves race away at roughly 3.5–4.5 km/s. So the seismic waves outrun the rupture, which is why the warning P-wave arrival, then the S-wave, then the surface waves, then the slow throbbing of building-period oscillations is the canonical earthquake sequence.
In a supershear earthquake, the geometry inverts. The rupture front breaks the local shear-wave speed barrier and gallops along at 4.5–6 km/s or faster, dragging a Mach cone of constructively interfering shear waves behind it: the seismic equivalent of a sonic boom, except dragged across hundreds of kilometres of crust. Far from the fault, that Mach front does not decay the way ordinary radiation does. It can deliver concentrated, high-amplitude shaking to places no one expects.
Supershear ruptures are rare. They have been claimed for the 1979 Imperial Valley, 2001 Kokoxili, 2002 Denali, 2013 Craig and Baluchistan, 2018 Palu, and 2023 Pazarcık events, but each case has been argued. The 2025 Mandalay earthquake left no room to argue.
Goldberg et al. resolved southward rupture velocities greater than 5 km/s and documented a Rayleigh Mach wave passing through Thailand. In the same issue of Science, Shengji Wei of Singapore’s Earth Observatory and his collaborators showed that the rupture began as bilateral and subshear, then transitioned to supershear at about 5.3 km/s roughly 100 km south of the epicentre, and sustained that velocity for more than 200 km. Their explanation: a ~2-km-thick low-velocity damage zone along the central Sagaing, a corridor of rock so chewed-up by previous earthquakes that its shear-wave speed is reduced by about 45%, combined with a bimaterial contrast across the fault (the rocks on one side are physically different from the rocks on the other) created a high-speed channel. Xu and colleagues frame the implication broadly: such large-scale supershear propagation, they conclude, can occur in interplate continental fault systems, not only in the rare oceanic or laboratory cases earlier work had suggested.
A third paper in the same package, by Liuwei Xu and Lingsen Meng at UCLA with collaborators at the Chinese Academy of Sciences and Nanjing University, used back-projection of high-frequency teleseismic energy to independently confirm a sustained supershear rupture extending about 450 km on the southern branch, with both far-field Mach waves and near-field ground motion supporting the supershear interpretation. Xu et al. emphasised four enabling factors: the fault’s startlingly linear geometry (the Sagaing runs nearly straight for ~700 km between latitudes 17°N and 23°N), the long interseismic quiescence in the Meiktila gap, a favourable ratio between fracture energy and available strain energy, and a pronounced bimaterial contrast across the fault interface — the same contrast that gives the paper its title.
The supershear behaviour explains, in a way that no other mechanism does, why a steel-and-concrete tower 1,000 km from the rupture in Bangkok came apart in eight seconds.
The 26 seconds that became data
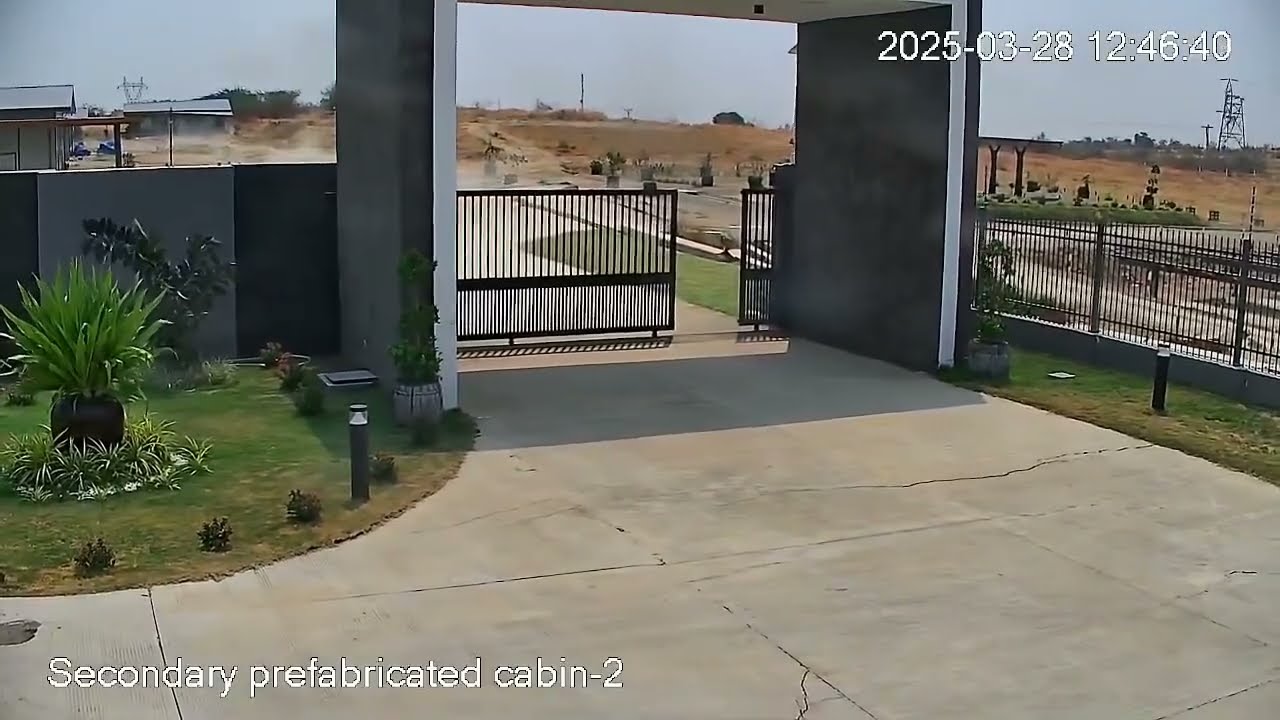
What turned the CCTV clip from a viral marvel into a scientific instrument was the geometry of the camera relative to the fault.
The Tha Pyay Wa camera was fixed, mounted on a sturdy post, and positioned about 20 m east of the Sagaing Fault trace, facing southwest. Crucially, it was looking across the fault, which means its field of view contained features on both the western (moving) and eastern (effectively stationary) blocks. That single fact made the footage a calibrated optical strain gauge. It also placed the camera about 120 km south of the hypocentre, far enough south that the rupture front, having travelled most of its run from the epicentre, was passing through at full ferocity.
Three teams went to work.
Kearse and Kaneko: pixel cross-correlation and a curved slip path
The first paper to appear was by Jesse Kearse, a postdoctoral researcher at Kyoto University who had previously studied curved slickenline, the scrape marks on exhumed fault surfaces, at the 2016 Mw 7.8 Kaikōura earthquake in New Zealand. Watching the Myanmar clip on his fifth or sixth viewing, Kearse noticed something his Kaikōura training had primed him for: the slip path was not straight. The ground on the western side hooked slightly as it accelerated, then straightened as it decelerated. The whole motion drew, in plan view, a subtle curve.
Kearse and his Kyoto colleague Yoshihiro Kaneko applied a technique called windowed pixel cross-correlation, frame by frame, tracking distinct features on both sides of the gate as they moved across the camera’s CMOS sensor. They calibrated against measured field dimensions to convert pixels into metres. The result, published in The Seismic Record on 18 July 2025 (DOI 10.1785/0320250024): the surface slip pulse had a magnitude of 2.5 ± 0.5 m, a duration of 1.3 ± 0.2 s, and a peak velocity of 3.2 ± 1.0 m/s, with a transient down-to-the-west dip-slip component of 0.3 ± 0.25 m occurring 0.5 s after slip began.
The brief pulse, Kearse said in the Kyoto University announcement, confirmed a pulse-like rupture — a “concentrated burst of slip” travelling down the fault “much like a ripple traveling down a rug when flicked from one end.”
That confirmation matters because earthquake scientists have argued for thirty-five years about whether large ruptures slip as pulses, short, localised bursts of motion that propagate down the fault, or as cracks, with the entire surface from the hypocentre to the rupture tip in motion simultaneously. The pulse model was first articulated by Thomas Heaton in 1990; for decades it has been inferred from waveform inversions and theoretical models, but never directly observed. The Tha Pyay Wa video confirmed it on a single fault, in a single event, at a single location, but with the kind of unambiguous in-situ resolution that no waveform inversion can match.
The curvature was a second discovery. Slickenlines, the scratch marks polished into fault surfaces during slip, are often curved, but slickenlines record only a fraction of total motion and can be overprinted by postseismic creep, gravity-driven movement, and other non-coseismic processes. Kearse and Kaneko’s analysis showed that the curvature occurs during the acceleration phase of slip and disappears during deceleration. Kearse’s interpretation, explained in remarks to the Seismological Society of America: transient stresses at the rupture tip push the fault briefly off its intended path during acceleration, after which it returns to the principal slip vector. The mechanism, Kearse and Kaneko argue, is dynamic stress concentration in the cohesive zone at the rupture tip, and the curvature direction is diagnostic of the propagation direction, which means slickenlines on dead faults can, in principle, tell future paleoseismologists which way past earthquakes ran.
“We did not anticipate that this video record would provide such a rich variety of detailed observations,” Kearse said.
Latour and colleagues: the slip-rate function, in real time
The second team, led by Soumaya Latour at the Institut de Recherche en Astrophysique et Planétologie in Toulouse, with collaborators from Laboratoire Navier, the Laboratoire de Géologie de l’ENS, Géoazur, and Southern California Edison published in Science in the same 30 October package as the rupture-dynamics papers. Latour et al. used a different image-analysis pipeline (manual tracking augmented by template matching, with explicit camera stabilisation and lens-distortion correction) but arrived at essentially the same numbers: a local slip duration of 1.4 seconds, cumulative slip of approximately 3 metres, and a peak surface slip velocity of about 3.5 m/s.
Their abstract puts the achievement in plain language: this is, they write, a “direct measurement of the slip-rate function” from a natural coseismic rupture — using CCTV footage shot meters from the fault trace. The slip-rate function, the time history of how fast the two sides of the fault move past each other, has been the holy grail of strong-motion seismology since the 1970s. Every kinematic simulation of strong ground motion, every dynamic rupture model, every estimate of the energy partition between fracture and radiation, depends on assumed slip-rate functions. They had been inverted from waveforms, modelled from lab experiments, and parameterised from dimensional analysis. They had never been measured directly.
Latour and colleagues then ran the function through slip-pulse elastodynamic rupture models and extracted the complete mechanical properties of the pulse, including the energy release rate. The fact that two independent teams, using different methods on the same 26 seconds, recovered slip values of 2.5–3.0 m, durations of 1.3–1.4 s, and peak velocities of 3.2–3.5 m/s is the kind of internal consistency that makes the result robust.
Hirano, Doke, and Maeda: supershear–subshear–supershear
A third paper, by Shiro Hirano, Ryosuke Doke, and Takuto Maeda, appearing in the open-access journal Seismica (DOI 10.26443/seismica.v4i2.1785), confronted an apparent contradiction that had nagged at attentive viewers from the start. Hubbard had flagged it almost immediately to CBC: “It doesn’t look like the quake was supershear at this location, because you see the seismic waves hit and the terrain shaking before the rupture occurs.”
If the rupture front had been outrunning the shear waves, the local order of arrivals at the camera should have been: rupture front, then S-waves. Instead, the gate at Tha Pyay Wa starts vibrating roughly two seconds before the ground splits. The S-waves arrive first; the rupture arrives second; the geometry is subshear at this location.
Hirano and colleagues combined the video evidence with strong-motion data from the GEOFON station NPW near Naypyidaw (about 246 km south of the hypocentre and 2.7 km west of the fault), with kinematic rupture modelling, and with satellite imagery, and concluded that the rupture propagation velocity was not constant. Near the hypocentre it appears to have been supershear, at around 6 km/s. It then decelerated to subshear (~3 km/s) by the time it reached the Tha Pyay Wa camera, in a slip-rate low between roughly 40 and 60 km south of the epicentre that coincides with a local minimum in surface offset (2–3 m). Beyond that point, the rupture re-accelerated and ran supershear for most of the southern 400 km, in agreement with the back-projection and finite-fault results of Goldberg, Wei, and Xu.
The picture that emerges from the three CCTV papers, taken together, is not a single supershear earthquake but a structurally modulated one, fast near the hypocentre, slow through a low-stress patch around 50 km south, then fast again all the way to Pyu. The Tha Pyay Wa camera happens to sit inside the slow patch, which is why local observers see the order they see and why scaling the 1.3-second pulse there to the entire 475-km rupture has to be done with care.
It is also exactly the kind of along-strike heterogeneity that probabilistic hazard models, which average over fault behaviour, do not capture.
The Meiktila gap closes after 186 years

In a Perspective accompanying the Science package, Kyle Bradley and Judith Hubbard, both former academic seismologists with PhDs from MIT and Harvard respectively and both now writing the Earthquake Insights newsletter, observed that the Sagaing rupture ran for more than 460 km, far longer than expected, and pushed the limits of how scientists think about how single earthquakes terminate. In their own first post on the event, dated 28 March 2025 (DOI 10.62481/9250a38a), they led with the headline “Catastrophic M7.7 earthquake caused by rupture of Sagaing Fault in Myanmar” under the deck “Limited reporting thus far from Myanmar, but this is a big one.”
The 2025 rupture did not just close the Meiktila gap. It overshot it. The northern terminus of the slip distribution, at about 22.5°N, lies just south of where the 1946 Mw 7.7 earthquake is thought to have ruptured and overlaps the patch that may have failed in the 1956 Mw 7.1. The southern terminus lies near Pyu, around 18°N, possibly overlapping the 1930 doublet rupture. The Mandalay earthquake, in other words, did not behave like a single segment failing; it behaved like a continental superhighway, cascading through three or four “segments” that had been mapped, on the basis of paleoseismology and geomorphology, as separable structures.
That is not a comforting result for the fault geologists who construct hazard maps by assigning maximum magnitudes to discrete segments. Bradley and Hubbard’s diagnosis in their Perspective is direct: long, straight, mature faults, the kind whose rocks have been damaged into a low-velocity corridor by previous events, appear to be able to deliver supershear ruptures that jump segments without slowing. The San Andreas, the North Anatolian, and New Zealand’s Alpine Fault all have segments that fit the description.
What the supershear did to Bangkok
The aerial map of central Myanmar after the earthquake shows the destruction tracking the fault: collapsed pagodas in Inwa, fissured highways near Sagaing, the dropped span of the Ava Bridge across the Irrawaddy. But the most photographed structural failure of the event was 1,000 km south of the epicentre, in a different country.
The State Audit Office tower in Bangkok’s Chatuchak district was a 33-storey under-construction high-rise, 137 m tall, topped out but only about 30% finished, in the middle of glass-wall installation. When the rupture front in Myanmar transitioned to supershear about 100 km south of the hypocentre and began radiating a coherent Mach front, that energy travelled south along the long, linear Sagaing corridor and then refracted into the soft Quaternary sediments of the Chao Phraya basin underlying Bangkok. Soft soils amplify long-period shaking. The natural sway period of a 30-plus-storey building is around 3 seconds. Pennung Warnitchai, a structural engineer at the Asian Institute of Technology and one of Thailand’s leading earthquake engineers, told the Bangkok Post Knowledge Forum 2025 that Bangkok’s soft soil and basin-like terrain slow and amplify long-period seismic waves; studies of the basin, he noted, have measured amplification factors of up to four: a direct hazard to high-rise buildings whose natural sway periods sit in exactly that band.
At about 13:20 local time, roughly half an hour after the rupture in Myanmar, the SAO building came down: in roughly eight seconds, by video, from the top. Final official figures from Thai authorities placed the toll at 96 deaths and 9 injuries, with rescue operations formally ending on 13 May 2025 at 89 confirmed dead and seven missing, the count rising to 96 as remains were identified through DNA matching. Subsequent investigations by the Thai government, three universities, and the Department of Special Investigation found design and construction defects in the shear-wall systems around the lift shafts and stairwells, plus the use of substandard induction-furnace steel produced by Xin Ke Yuan Steel, whose factory in Ban Khai district, Rayong province, was temporarily closed by the Industry Ministry after products were found to be of substandard quality. At an on-site news conference on 30 March 2025, Industry Minister Akanat Promphan said test results on steel samples from the site had shown anomalies that warranted further investigation. By 15 May, the Bangkok Criminal Court had issued arrest warrants for 17 individuals; according to the Bangkok Post, Premchai Karnasuta, 71, president of Italian-Thai Development Plc, and the other 16 suspects faced charges under sections 227 and 238 of the Criminal Code for professional negligence causing death.
But Bangkok seismologists have been just as clear that the building, even built to code, was unlucky to be on the receiving end of a Mach wave. Heavy shaking was felt in the Thai capital because of the supershear nature of the rupture and the basin amplification of the soft Chao Phraya sediments, which together led to the collapse. The peak floor-level acceleration on the 33-storey tower was about 123 milli-g: small in absolute terms, but applied to a structure already swaying at its resonant frequency and supported by steel that did not meet code.
The SAO tower was the only high-rise in Thailand to collapse. The Bangkok episode is the canonical example of why supershear rupture is not an esoteric mechanical curiosity: it is the reason a fault failure in central Myanmar can kill nearly a hundred construction workers in another country.
The human cost, attributed carefully
The death toll in Myanmar itself is uncertain in a way that has more to do with civil war than with seismology. The 2021 coup, the dissolution of independent media, the continuing armed conflict between the State Administration Council and the National Unity Government and various ethnic armed organisations, and the routine targeting of the affected regions by SAC airstrikes during the response phase: all of these have made body counts a political artefact.
The UN Office for the Coordination of Humanitarian Affairs (OCHA), in Situation Report No. 4 on 25 April 2025, cited 3,800 deaths, 5,100 injuries, and 116 people missing, drawing on the ASEAN Coordinating Centre for Humanitarian Assistance on disaster management (AHA Centre), which in turn drew on State Administration Council figures. The SAC’s own running total in early May 2025 was 3,770 dead, 5,106 injured, 106 missing. Independent Myanmar media tallies were materially higher: the Democratic Voice of Burma’s data team, compiling reports from the field, recorded approximately 4,549 deaths and 11,366 injuries on its running earthquake dashboard at english.dvb.no; Mizzima News, working from morgue reports and community correspondents, reported 5,352 fatalities in Myanmar alone. To these in-country figures must be added 103 deaths in Thailand (mainly the SAO collapse plus a handful of others) and one death attributed to shock in Ho Chi Minh City. By any of these accountings, the Mandalay earthquake is the second deadliest in Myanmar’s modern history, surpassed only by upper estimates of the 1930 Bago event.
OCHA’s mapping of the response footprint is starker than the body counts. As of early April 2025, an estimated 17.2 million people were living in earthquake-affected areas; 9.1 million were exposed to the strongest shaking; 58 of 330 townships were classified as severely affected. Initial rapid needs assessments across 55 townships found that around 52% of houses had suffered damage. More than 120,000 homes, 2,500 schools, hundreds of pagodas and monasteries, and the Ava Bridge were destroyed or unusable. More than 6,730 telecommunications stations were damaged. The earthquake hit during the hottest, driest month of the Burmese year, with daytime highs near 39°C, and ahead of the monsoon; the OCHA Flash Addendum to the 2025 Humanitarian Needs and Response Plan, calling for $275 million, had received only $34 million in tracked disbursements by 25 April.
There is no neat way to write this paragraph that does not sound bureaucratic. The science of the earthquake will outlast the regime; the people it killed will not.
What is “unaccounted risk”
The phrase in the title of Goldberg et al.’s paper, “reveals unaccounted risk”, is a technical claim, not a rhetorical one.
Probabilistic seismic hazard analysis (PSHA), the framework underlying essentially every modern seismic building code, takes a fault, divides it into segments, assigns a maximum credible earthquake to each segment based on length-magnitude scaling relations (Wells and Coppersmith 1994 and its descendants), assigns recurrence intervals from paleoseismology or geodesy, and convolves the whole thing into a probability of exceedance for ground motion at any site. The framework is robust against ordinary earthquakes. It is not robust against ultralong ruptures.
The 1906 San Francisco earthquake, Mw 7.9, rupture length about 470 km, was for a century the only modern instrumental example of a continental strike-slip rupture this long. Hazard models built after 1906 quietly accommodated it as an outlier. After Mandalay, it is no longer an outlier; it is one of two. The pattern that emerges from the two events together is similar: a long, straight, mature fault; a long interseismic gap; a damage corridor of low-velocity rock; bilateral propagation; sustained supershear over a substantial portion of the rupture.
The faults that fit the description are not obscure. The San Andreas south of San Francisco, especially the Carrizo Plain segment that last broke in 1857, is one. The North Anatolian Fault east of the 1999 Izmit rupture, where a westward-migrating sequence has left a single segment near Istanbul unfailed since 1766, is another. New Zealand’s Alpine Fault, which Berryman and colleagues, analysing 24 earthquakes recorded in the Hokuri Creek paleoseismic trench over 8,000 years, established as producing magnitude-8 earthquakes roughly every 330 years on average, is a third. The Dead Sea Transform, the Denali, the Altyn Tagh, each has segments long enough and straight enough to potentially host an ultralong rupture.
“For large strike-slip faults, those models usually assume a tight link between earthquake magnitude and the maximum length of rupture. The Mandalay results show that some earthquakes can produce ultralong ruptures without reaching the very largest magnitudes assumed in many hazard maps,” the USGS noted in its summary of Goldberg’s findings.
This does not mean every long strike-slip fault is about to deliver a 500-km rupture. It means that hazard models have to make explicit room for the possibility that they could: and that the resulting near-fault shaking from a Mw 7.7 ultralong-rupture earthquake covers an area an order of magnitude larger than current maps anticipate.
What the camera could not see
A small, important coda. The Tha Pyay Wa camera saw the rupture, but it did not see the fault at depth. The rupture front it captured was the trailing surface expression of a process happening at 5–10 km depth, in a “cohesive zone” perhaps a few kilometres across, where rock was disintegrating along the fault plane at a rate of millions of cubic metres per second. The camera saw the consequence, not the cause. The 2.5-metre slip in 1.3 seconds is the surface integral of a far more complex dynamical process below.
This is why the Kearse–Kaneko and Latour papers matter less as confirmations of any single number and more as boundary conditions on theoretical models. The slip-rate function the camera recorded is now a constraint on every dynamic rupture model published from now on. If the model can produce a curved, pulse-like, 1.3-second, 2.5-metre slip episode under the local stress conditions of the Sagaing Fault, it survives. If it cannot, it is wrong. For a science that has spent decades reverse-engineering ruptures from waveforms recorded hundreds of kilometres away, that change in evidence base is fundamental.
It also means the camera is now a kind of seismological saint. Forty-three days after the earthquake, when Htin Aung posted the file to Facebook, neither he nor the YouTube archivist who picked it up had any particular reason to expect what would follow. They were posting evidence. They were not curating data. By the end of October 2025, the 26-second clip had been processed by at least four independent research teams, cited in three peer-reviewed papers in Science, The Seismic Record, and Seismica, and used to constrain models of dynamic rupture from Kyoto to Pasadena to Singapore. A surveillance camera became a primary scientific instrument because it was pointed in the right direction by accident.
The kicker
There is a moment in the Tha Pyay Wa clip, about 22 seconds in, when the camera, having survived the rupture, registers the first major aftershock. The gate, which has been hanging askew for several seconds, vibrates again. The hill in the background, now offset, shudders. A power cable that has not yet fallen finally falls. And then the camera, still recording, settles back into its job of watching nothing in particular.
Somewhere in Singapore, Htin Aung had not yet seen the file. Somewhere in Naypyidaw, the SAC was issuing its first damage estimates. Somewhere in Ithaca, Judith Hubbard was already drafting a Substack post that would carry the DOI 10.62481/9250a38a. The earthquake was over and the science had not yet begun.
In Tha Pyay Wa, the camera kept running.
Frequently asked questions
What is a supershear earthquake?
A supershear earthquake is one in which the rupture front along the fault propagates faster than the local shear-wave speed in the surrounding crust, typically faster than about 4.5–5 km/s. In ordinary earthquakes the seismic shear waves outrun the rupture. In a supershear event the rupture overtakes its own shear waves and drags a “Mach cone” of constructively interfering energy behind it, similar to a sonic boom. This concentrated radiation can deliver intense long-period shaking far from the fault. Sustained supershear ruptures are rare; the 2025 Mandalay earthquake was confirmed as one of the clearest examples ever recorded, with rupture velocities greater than 5 km/s sustained over hundreds of kilometres of the Sagaing Fault.
Where is the Sagaing Fault?
The Sagaing Fault is a ~1,400-km-long right-lateral transform fault running almost dead north–south through Myanmar (Burma). It forms the boundary between the Burma microplate to the west and the Sunda Plate to the east, linking the Andaman spreading centre offshore in the south to the Eastern Himalayan syntaxis in the north. It passes through or close to most of Myanmar’s major cities, including Yangon, Naypyidaw, Mandalay, and Sagaing. It is structurally analogous to California’s San Andreas Fault, with a present-day geodetic slip rate of about 18–24 mm/yr.
How long was the Mandalay earthquake rupture?
The 28 March 2025 Mw 7.7 Mandalay earthquake ruptured approximately 475 kilometres of the central Sagaing Fault, according to the USGS-led analysis published by Goldberg et al. in Science in October 2025. That length is between 1.6 and 4.7 times longer than empirical magnitude-length scaling relations predict for a Mw 7.7 strike-slip earthquake, making it the longest continental strike-slip rupture ever instrumentally recorded. The rupture propagated bilaterally: about 75 km north of the hypocentre and roughly 400 km south, terminating near Pyu in the Bago Region.
What did the CCTV video show?
The CCTV video from the Tha Pyay Wa solar farm, in Thazi Township, captured the surface expression of the Sagaing Fault rupture passing about 20 m west of the camera. Frame-by-frame pixel cross-correlation by Kearse and Kaneko (2025), and independent image analysis by Latour and colleagues (2025), measured a pulse of horizontal fault slip of about 2.5–3 m, lasting roughly 1.3–1.4 seconds, with a peak slip velocity of 3.2–3.5 m/s. The slip path was subtly curved, confirming a long-standing prediction from slickenline geology and dynamic rupture theory that fault slip is not perfectly straight. The video is the first known direct recording of a great-earthquake surface rupture in action.
Why was the Bangkok damage so severe so far away?
Bangkok lies about 1,000 km from the Mandalay earthquake’s epicentre: far enough that ordinary seismic energy would have been heavily attenuated. Two factors amplified the shaking. First, the rupture’s supershear propagation along the southern Sagaing Fault generated a coherent Mach front that beamed long-period energy southward. Second, Bangkok sits on the soft Quaternary sediments of the Chao Phraya basin, which structural engineers including AIT’s Pennung Warnitchai estimate can amplify long-period seismic waves by up to four times. The combination caused the 33-storey State Audit Office building under construction in Chatuchak district to collapse in about eight seconds, killing 96 workers. Subsequent investigations also identified design and construction defects in the building, but the seismic conditions were exceptional.
Has any other earthquake been filmed like this?
Many earthquakes have been recorded by security cameras showing shaking, collapsing buildings, swaying lights, panicked crowds. The Tha Pyay Wa clip is different because it captured the surface trace of the fault itself, with calibrated geometry, in motion. Surface ruptures have been photographed after the fact since the 1906 San Francisco earthquake (split fences, offset roads), the 2002 Denali earthquake (offset curbs), and the 2023 Kahramanmaraş earthquakes (drone footage of offset fields), but none had previously been filmed in action by a stationary camera. As Rick Aster of Colorado State University told Live Science, “this is the best video we have of a throughgoing surface rupture of a very large earthquake.”
How many people died in the Mandalay earthquake?
The death toll is uncertain because of Myanmar’s civil war and the restrictions on independent reporting since the 2021 coup. UN OCHA Situation Report No. 4 (25 April 2025), citing ASEAN’s AHA Centre, reported 3,800 deaths and 5,100 injuries in Myanmar. The State Administration Council’s own figure was similar. The Democratic Voice of Burma’s data team independently compiled approximately 4,549 deaths and 11,366 injuries, while Mizzima News reported 5,352 fatalities in Myanmar. Add 103 deaths in Thailand (mainly the State Audit Office tower collapse in Bangkok) and one death in Vietnam, and the most commonly cited combined totals fall in the range of 4,650–5,500. By any of these accountings, the Mandalay earthquake is the second deadliest earthquake to strike Myanmar since 1900, surpassed only by the 1930 Bago event under its higher casualty estimates.