


The Dickson Fjord Landslide of September 2023
At 12:35 UTC on 16 September 2023, a slab of metamorphic rock 600 metres long, 480 metres wide and 150 metres thick parted company with the side of Hvide Støvhorn, a peak above Dickson Fjord in the Northeast Greenland National Park that almost nobody on Earth has heard of. Twenty-five million cubic metres of gneiss and glacial ice, enough to fill ten thousand Olympic swimming pools, fell 1,200 metres into the cold green water of Dickson Fjord at a peak velocity of around 42 metres per second. The impact threw a wall of water 200 metres into the air against the opposite cliff. Then the fjord began to ring like a struck bell.
It rang for nine days.
The signal that reached seismometers across every continent that afternoon was not the chaotic, broadband shudder of an earthquake. It was a single sustained tone at 10.88 millihertz: a 92-second period sine wave so clean and persistent that the seismologists who first saw it on their screens assumed their instruments were broken. The signal kept going. Nobody had ever recorded anything like it. For days the global seismology community traded screenshots and hypotheses on a chat server, ruling out volcanoes, ruling out ice quakes, ruling out anything they had a name for. They called the thing on their screens an Unidentified Seismic Object. The acronym, USO, was meant as a joke. Then it stuck.
An Unidentified Seismic Object
The signal arrived in Greenland first. The closest station to Dickson Fjord that recorded it, DK.SCO at Ittoqqortoormiit, is 313 kilometres away on the same coast. From there the wave train propagated outward through the Earth’s crust, hitting broadband seismometers in Scandinavia, in continental Europe, in North America, and within roughly an hour it had reached Antarctica. Stations everywhere registered the same eerie property: instead of the frequency-rich rumble that any geophysicist would recognise as an earthquake, the trace was a near-perfect sinusoid at a single frequency. Long-period analysts call this kind of waveform monochromatic, one note, one pitch, holding steady for hour after hour.
The first thing a seismologist does when faced with an anomaly is check the catalogue. There was no earthquake in the catalogue. There was no eruption on the Smithsonian Global Volcanism Program’s weekly bulletin. The Comprehensive Nuclear-Test-Ban Treaty’s infrasound network at I37NO in Norway and I43RU in Russia picked up acoustic signatures from up to 3,310 kilometres away, but those gave no help in identifying a source. Whatever had happened, it was generating an oscillating horizontal force somewhere on the planet, and that force was still being applied.
The “USO” label, and what it ruled out
Stephen Hicks, then a research fellow in computational seismology at UCL Earth Sciences, was one of the people staring at the signal. He had seen plenty of strange things on a seismometer in his career, landslides, glacier calvings, the unique chirp of a bolide entering the atmosphere, but never a tone this clean for this long. In the UCL press release that accompanied the eventual Science publication, Hicks described the feeling plainly:
“When I first saw the seismic signal, I was completely baffled. Even though we know seismometers can record a variety of sources happening on Earth’s surface, never before has such a long-lasting, globally travelling seismic wave, containing only a single frequency of oscillation, been recorded.”
The label USO was Hicks’s coinage. In an essay he later co-wrote with the Danish landslide scientist Kristian Svennevig for The Conversation, the two researchers described the moment plainly: “Earthquake scientists detected an unusual signal on monitoring stations used to detect seismic activity during September 2023. We saw it on sensors everywhere, from the Arctic to Antarctica. We were baffled, the signal was unlike any previously recorded.”
What the label ruled out mattered. The signal was not a volcanic tremor: tremor has harmonic overtones and a source that wanders in frequency as gas pressure fluctuates. It was not a glacial event of any kind the community had on file: ice quakes have characteristic short-period content. It was not human in origin, ruling out cultural noise. By the second day the working hypotheses on the seismology chat, hosted on a Mattermost server operated by AskTom SCS, a detail the authors thought important enough to acknowledge in the eventual paper, had drifted into stranger territory. Thomas Lecocq at the Royal Observatory of Belgium suggested, half-joking, an “alien slow party”. Hicks, when pressed by Quanta Magazine, admitted that “if we found no other explanation, we would have gone for sea monster or baby dragons”.
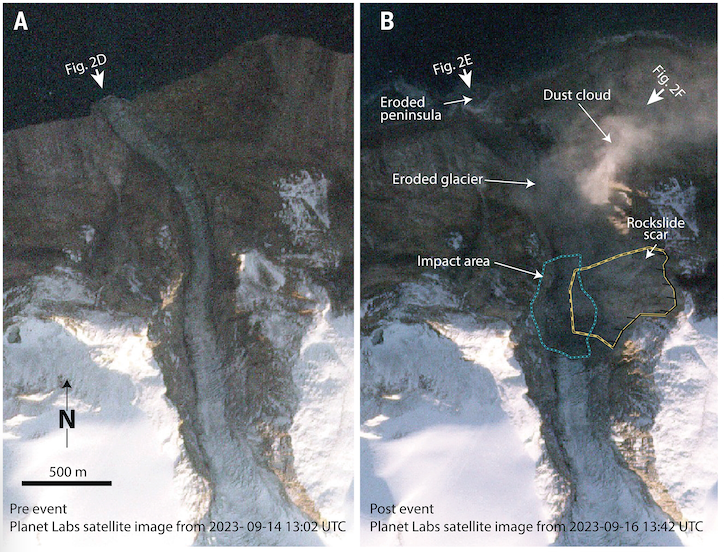
The Hvide Støvhorn Landslide: 12:35 UTC, 16 September 2023
Hvide Støvhorn, Danish for “White Dust Horn”, sits at 72.80° north, 26.90° west, a sharp metamorphic peak rising above the south wall of Dickson Fjord in the eastern arm of the Greenland fjord system. The bedrock here is Caledonian: Proterozoic gneiss with strong, foliation-parallel weakness planes that dip into the fjord at about 45 degrees. The architecture is standard for the region: a sharp horn, oversteepened by Pleistocene ice that no longer fully supports it, with discontinuities in the rock running in the wrong direction for stability. The geological set-up at Hvide Støvhorn is exactly what high-latitude landslide geologists look for, and increasingly find.
The slab that detached on 16 September was up to 150 metres thick, 480 metres wide, 600 metres long. The failure plane was the foliation. Once it broke free the mass accelerated down a gully that had been carved and then partially abandoned by a small valley glacier. The avalanche entrained roughly 2.2 million cubic metres of additional ice from the uppermost 13 metres of that glacier as it went, scouring the gully clean down to bedrock and arriving at the fjord water surface as a rock-ice slurry moving at around 150 kilometres per hour.
How a glacier had been undermining its own buttress
The trigger sat at the bottom of the slope. The small gully glacier that ran beneath the unstable slab had been thinning for decades. Using ArcticDEM elevation differencing combined with historical aerial photography, Kristian Svennevig and his co-authors at the Geological Survey of Denmark and Greenland (GEUS) tracked the surface of that glacier from 1985 to 2018. The lower part of the glacier, the section that physically pressed against the foot of the Hvide Støvhorn slab, lost up to 27 metres of elevation over those thirty-three years. Glaciologists call this debuttressing. As the ice that holds a rock wall in place thins and retreats, the wall is gradually released, first elastically, then through slow inelastic creep, then, when some final stress threshold is crossed, catastrophically.
This is not speculative. The mechanism has been documented for high-latitude and alpine landslides for several decades. What was new about the Hvide Støvhorn failure was that the chain of causation could be drawn through a specific glacier and a specific timeframe to a specific slab of rock. Svennevig, who has spent much of his career mapping Greenland’s growing landslide inventory, summarised it in the UCL release: “this is the first-ever landslide and tsunami observed from eastern Greenland, showing how climate change already has major impacts there.”
The Dickson Fjord Tsunami: A 200-Metre Backsplash
Twenty-five million cubic metres of rock and ice entering a 540-metre-deep, 2.7-kilometre-wide fjord does not behave like a polite displacement of fluid. The leading edge of the avalanche slammed into the water with a single coherent impulse. Numerical models built by Anne Mangeney’s group at the Institut de Physique du Globe de Paris and Manuel Castro-Díaz’s group in Málaga, using the HySEA shallow-water solver at three-metre grid spacing, reconstructed what happened next. The avalanche pushed a wedge of fjord water against the opposite cliff and threw it 200 metres up the rock face. The backsplash is the headline number of the entire event, a tsunami runup higher than any landslide-tsunami on record between the 1980 Spirit Lake displacement and the Tracy Arm event of 2025.
Subsequent waves were smaller, but only by the standards of the first. The reflected and dispersed wave train sloshing back and forth in the immediate vicinity of the impact reached up to 110 metres against various sections of the fjord wall. Within ninety seconds the localised tsunami was fully developed; within ten minutes the leading wave had begun its 72-kilometre journey down the fjord system toward the open Greenland Sea.
The 72-km journey to Ella Ø
Ella Ø, Ella Island, is a small mountainous island in Kong Oscar Fjord, 72 kilometres out-fjord from the landslide source. It is the summer substation of the Sirius Patrol, the Danish special-operations dog-sled unit that has patrolled Northeast Greenland since 1950. The station is shared with Nanok, a civilian heritage organisation that maintains a network of huts across the uninhabited northeast. By mid-September the patrol was winding down its summer season; on 16 September the station was unoccupied.
The tsunami arrived as a four-metre wave. It inundated up to 80 metres inland and washed roughly USD 200,000 of infrastructure, buildings, fuel drums, equipment, into the sea. Had a single dog team been at the station that afternoon, the story now in the geophysical literature would be one of fatalities. As it happened, the only casualties were huts.
Two other near-misses sharpen the point. The Danish military vessel Knud Rasmussen visited Dickson Fjord on 19 September, three days after the rockslide, and saw nothing unusual on the surface, even though the seiche was still oscillating below decks. Five days before the landslide, on 11 September, the cruise ship MV Ocean Explorer, carrying 206 passengers and crew, had run aground in Alpefjord, part of the same Northeast Greenland National Park fjord system, and was pulled free at high tide on 14 September by a Greenland Institute of Natural Resources research vessel. The cruise ship had departed the protected fjord network roughly two days before the wave that would have destroyed it.
Why Dickson Fjord Sang for Nine Days
A normal tsunami should die in hours. The energy radiates out into the open ocean, dispersing across thousands of kilometres of bathymetry, and within a day the original signal is below the noise floor of even the best tide gauges. Dickson Fjord did not behave like that. The reason is geometry.
Dickson Fjord is a narrow trough about 35 kilometres long, walled on both sides by cliffs that rise hundreds of metres above sea level and drop hundreds of metres below it. Its cross-section is closer to a bathtub than to an open coast. When a coherent wave is generated transverse to such a basin, perpendicular to its long axis, the energy does not radiate away. It reflects between the two walls and sets up a standing wave: a seiche. The fjord becomes a resonator, like an organ pipe with the air column replaced by cubic kilometres of cold seawater.
What the HySEA numerical model showed was that the rock-ice avalanche, striking the south wall at an oblique angle, had injected exactly the right kind of impulse to excite the fundamental cross-fjord mode of Dickson Fjord. Once that mode was excited, it would oscillate until friction, viscous dissipation, bottom drag, leakage out the ends of the fjord, bled the energy away. In a narrow, deep, smooth-walled fjord with a complicated dog-leg geometry that traps energy at certain bends, that bleeding is very slow.
The small gap that taught us about bathymetry
The observed global seismic signal had a frequency of 10.88 millihertz: a period of 92 seconds. The HySEA model, using the best available bathymetry of Dickson Fjord, predicted a seiche frequency of 11.45 millihertz: a period of 87 seconds. The two numbers differ by about five percent. In numerical fluid dynamics, a five percent agreement between a forward model and an observation, on a system with this much complexity, is excellent. But the gap is informative.
The model’s seiche was slightly faster than the real one, which means the model fjord was slightly stiffer than the real one. The most plausible explanation is that the bathymetric grid used in the simulation, even at three-metre spacing, was missing some of the topographic complexity at the bends and constrictions where seiche energy is most strongly trapped. A more deformable basin oscillates more slowly. The seismic signal was telling the modellers something specific about the shape of the fjord floor that the bathymetry did not yet fully resolve.
The seiche’s simulated peak amplitude was 7.4 metres. The single horizontal force radiated outward by the oscillating water mass, the quantity that long-period seismologists invert directly from the global waveforms, was 5 × 10¹¹ newtons. The wave’s quality factor Q, a dimensionless measure of how slowly an oscillator loses energy, started at around 500 and rose toward 3,000 as the seiche settled into its narrowest spectral peak. By comparison, the free oscillations of the Earth excited by the largest earthquakes have Q values of a few hundred to a few thousand depending on mode. Dickson Fjord, briefly, was as good a resonator as the planet itself.
Thomas Forbriger of the Karlsruhe Institute of Technology’s Black Forest Observatory, one of the long-period specialists on the team, made the methodological point in the UCL release: “We wouldn’t have discovered or been able to analyse this amazing event without networks of high-fidelity broadband seismic stations around the world, which are the only sensors that can truly capture such a unique signal.” The instruments designed to listen for the ringing of the Earth were the ones that caught a fjord pretending to be the Earth.
How 68 Scientists Solved It
The Mattermost channel and the seismometer archives
The detective work that turned the USO into a 25-million-cubic-metre rockslide in Dickson Fjord did not happen at a single institution. It happened on a chat server. By Monday 18 September, two days after the signal began, seismologists in Europe, North America, the Arctic and the Antarctic were posting waveforms and asking each other to confirm what they were seeing. The discussion took place on a Mattermost instance, an open-source alternative to Slack, hosted by an independent operator. The paper’s acknowledgements thank “AskTom SCS for hosting this service”, a detail that is easy to miss but worth pausing over: a critical piece of the world’s seismological response to a previously unknown class of geohazard ran on a privately maintained chat server.
Svennevig himself was the one who connected the signal to a place. In Copenhagen on the Monday morning, he heard separately, through the Danish Joint Arctic Command, that the Sirius Patrol station at Ella Ø had been damaged by something. He checked the satellite record for Dickson Fjord and found the scar on the south wall. The link from the seismic anomaly to a specific mountain was made within about seventy-two hours of the event. Putting numbers on the link took another eleven months and 68 scientists at 40 institutions in 15 countries.
The team was assembled the way scientific teams now assemble: ad hoc, on the basis of who could contribute what. Paula Koelemeijer at Oxford, Anne Mangeney at IPGP, Clément Hibert at Strasbourg, Carl Ebeling at Scripps, Finn Løvholt at the Norwegian Geotechnical Institute, Wieter Boone of the Flanders Marine Institute and Søren Rysgaard at Aarhus University were among the senior contributors; the work split across seismic analysis, fluid-dynamic modelling, satellite imagery, and Greenland-side field photography taken from helicopter overflights.
The paper was submitted to Science on 9 January 2024, resubmitted on 19 June, accepted on 6 August, and published on 13 September 2024 in volume 385, issue 6714. Almost exactly one year after the mountain fell.
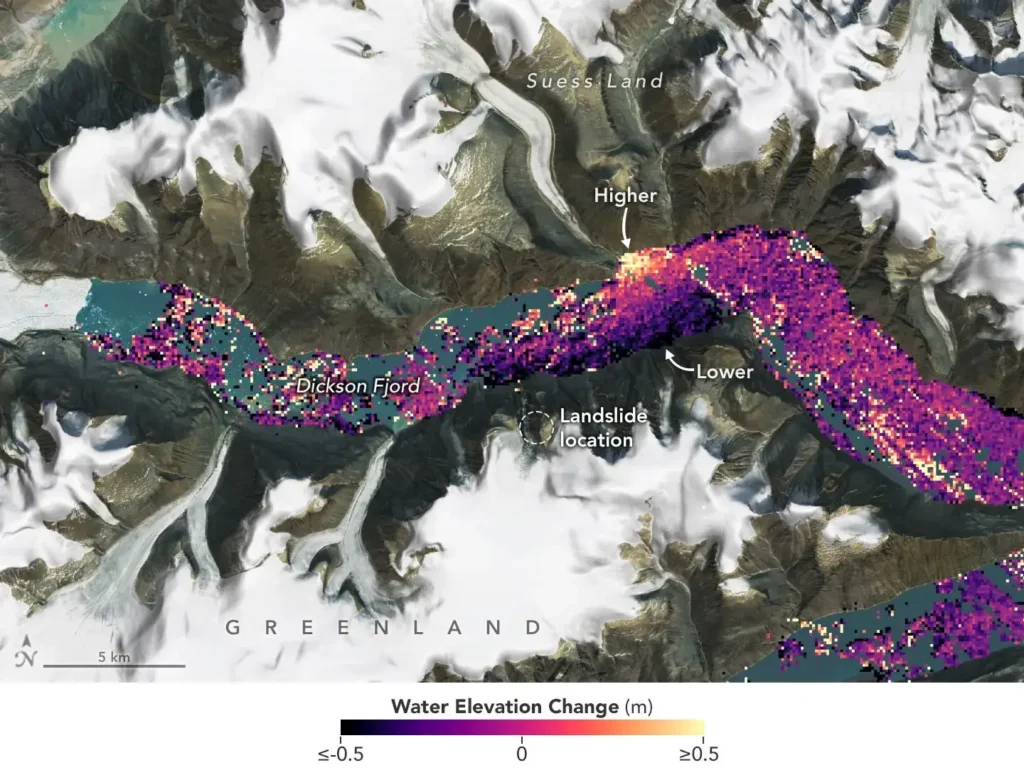
The SWOT satellite confirmation, 18 months later
The numerical model said the seiche should have had a maximum amplitude of 7.4 metres and a cross-channel slope of around 2–3 metres per kilometre. Nobody had directly observed the wave: every human visitor to the fjord in the days that followed reported a calm surface, because the period of the oscillation, 92 seconds, was long enough that an observer standing on the deck of a ship would simply feel the entire vessel rise and fall together, with no visible wave to point at.
The confirmation came from orbit. In 2022, NASA and CNES had launched the Surface Water and Ocean Topography mission, SWOT, whose KaRIn radar interferometer can measure the height of a water surface across two 50-kilometre swaths separated by a 20-kilometre nadir gap, at metre-scale horizontal resolution. SWOT’s primary mission is to map small-scale ocean eddies and the height of inland rivers, lakes and reservoirs. Its incidental capacity to resolve the cross-channel tilt of a narrow fjord during a freak seiche was not anticipated by the mission’s designers.
Thomas Monahan, a doctoral student in engineering science at the University of Oxford, recognised that SWOT had been overflying Dickson Fjord during the nine days the seiche was active. He found usable SWOT passes covering both the September event and the smaller repeat event on 11 October 2023. Working with a Bayesian machine-learning pipeline that disentangles seiche signals from tides and noise, Monahan and his co-authors reconstructed the cross-channel slope of the water surface from the satellite data. Their result, published in Nature Communications on 3 June 2025, was an empirical initial seiche amplitude of 7.9 metres, sitting inside Svennevig’s 7.4–8.8 metre numerical range.
Monahan framed it carefully in the Oxford press release: “Climate change is giving rise to new, unseen extremes. These extremes are changing the fastest in remote areas, such as the Arctic, where our ability to measure them using physical sensors is limited. This study shows how we can leverage the next generation of satellite earth observation technologies to study these processes. SWOT is a game changer for studying oceanic processes in regions such as fjords which previous satellites struggled to see into.”
The Verdict on Climate Change
The 27-metre glacier thinning that pulled the trigger
The mountain did not fall because of a particular afternoon. It fell because of thirty-three years. The chain of evidence assembled by the team is short and direct. ArcticDEM and historical aerial photographs document a gully glacier that thinned by up to 27 metres between 1985 and 2018. That thinning removed support from the foot of an oversteepened, foliation-controlled rock slope. The slope failed when the residual strength of its weakest plane was finally less than the gravity-driven shear stress acting along that plane. Other things were happening to the rock as well, water in fractures, freeze-thaw cycles, possibly elevated pore pressures from a wet summer, but the proximate cause sits in the elevation difference between two pixels of an ArcticDEM tile.
This is the unusual feature of Dickson Fjord as a climate-change story. The link from atmospheric carbon dioxide to a destabilising slope is normally several steps removed. Here the link is concrete enough to plot: rising regional temperatures over the late twentieth century, thinning of a specific small valley glacier, debuttressing of a specific buttress, failure of a specific slab. The signal in the rock was made audible by the signal in the ice.
Svennevig, in his AFP interview, put it plainly: “The completely unique thing about this event is how long the seismic signal lasted and how constant the frequency was. Other landslides and tsunamis have produced seismic signals but only for a couple of hours and very locally. This one was observed globally all the way to the Antarctic. With the Arctic continuing to warm we may expect the frequency and magnitude of such events to increase in the future. We have no experience with dealing with an Arctic as warm as we observe now.”
Karrat 2017, Barry Arm, Taan: the pattern in polar fjords
Dickson Fjord is not the only fjord wall that has been failing. On 17 June 2017, on the opposite side of Greenland, a 45-million-cubic-metre rock avalanche slid off Ummiammakku Mountain into Karrat Fjord, sending a tsunami that struck the village of Nuugaatsiaq 32 kilometres away with a nine-metre wave. Four people died. Eleven houses were destroyed. Both Nuugaatsiaq and the neighbouring settlement of Illorsuit were permanently evacuated. A 2023 GEUS reassessment of the same slope concluded that a future Karrat 3 failure could be an order of magnitude larger than the 2017 event, with a worst-case runup of 74 metres at the former village site.
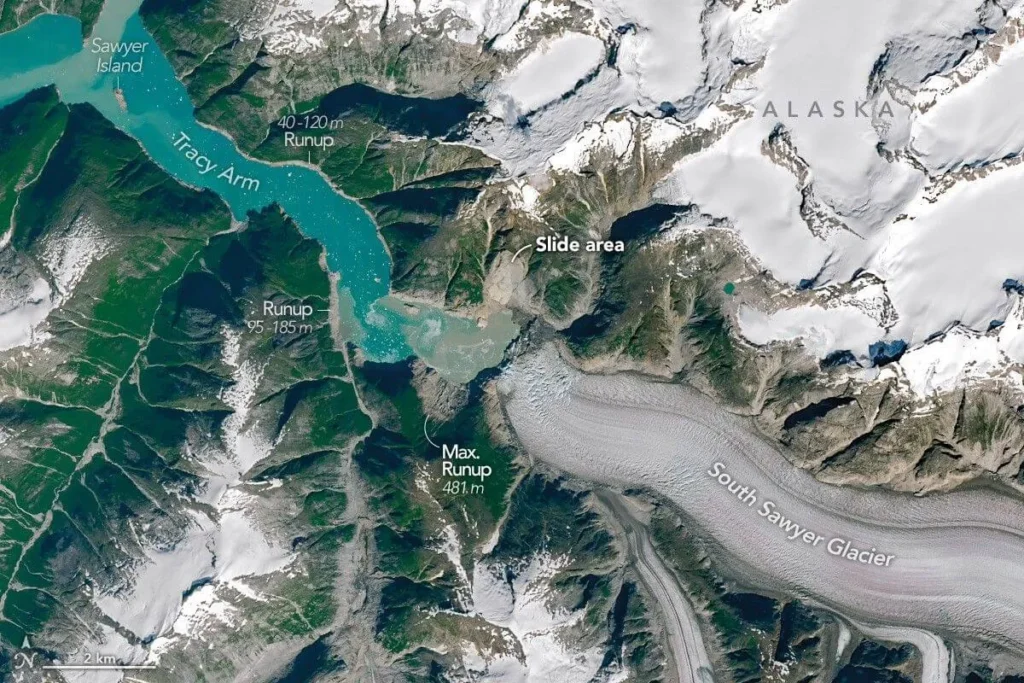
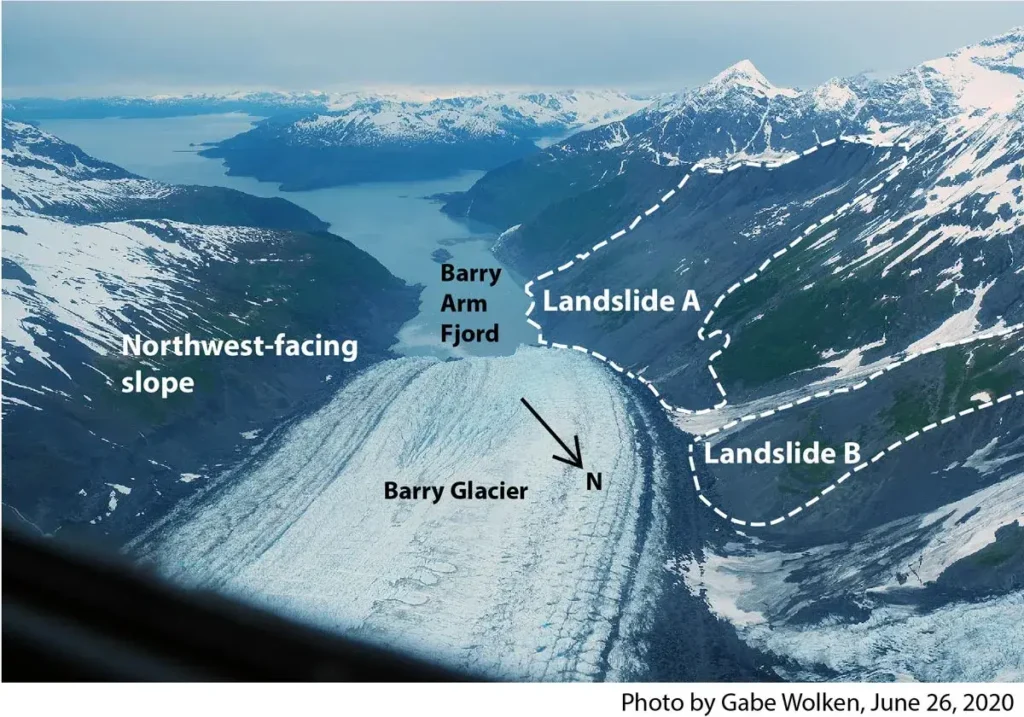
In Alaska, on 17 October 2015, the Tyndall Glacier’s retreat had so destabilised its lateral moraine that 76 million cubic metres of rock fell into Taan Fjord, generating a tsunami that ran up the opposite shore to 193 metres, at the time among the highest landslide-tsunami runups ever recorded. In Prince William Sound, a slow-moving slope at Barry Arm has been creeping toward the fjord since at least the late 2010s, in tandem with the rapid retreat of Barry Glacier; the U.S. Geological Survey monitors it continuously with seismometers, GNSS and InSAR because a fast failure would put cruise traffic at risk. And most recently, on 10 August 2025, a 64-million-cubic-metre failure at the head of Tracy Arm in Southeast Alaska produced a runup of 481 metres, the second-highest landslide-tsunami runup ever recorded, behind only Lituya Bay 1958. Tracy Arm also rang. A 66-second seiche signal, smaller and shorter than Dickson Fjord’s, was detected globally for 36 hours.
The National Park Service’s analysis of the global record is blunt. Of the fourteen highest tsunami runups documented in the last hundred years, ten occurred in glaciated mountains, and four of those ten occurred in Alaska parks alone. The pattern is obvious. Where ice has been removed from a recently glaciated landscape and the slopes that the ice was holding up are not yet stable, the ground will eventually move. Whether it falls into water, and whether anyone is there when it does, is then a matter of geometry and timing.
What Comes Next
The Svennevig paper closes carefully: “Our findings highlight how climate change is causing cascading, hazardous feedbacks between the cryosphere, hydrosphere, and lithosphere.” This cascade is what makes Dickson Fjord new. The rock failed because the ice retreated. The ice retreated because the atmosphere warmed. The tsunami formed because the rock fell. The seiche persisted because the fjord was shaped like a resonator. And the resonator was driven hard, damped lightly, so the signal travelled the world. Each step was known before September 2023. They had never been observed together at this scale.
The historical record, once the team knew what to look for, suggested it had been happening quietly all along. A systematic search of the global seismic catalogue from 1990 onward, supplemented by gravimeter records going back to 1982, turned up four earlier monochromatic VLP signals at almost exactly the same frequency, all of them shorter and smaller. Two of those earlier events occurred in winter, under fjord ice cover. A fifth event, on 11 October 2023, less than a month after the main collapse, was a half-amplitude repeat at the same gully. The fjord has been singing softly for at least thirty years. In September 2023 it sang loudly enough to be heard.
The infrastructure for hearing it is the Global Seismographic Network and its peers: several thousand broadband stations operated by national agencies and consortia like EarthScope and the GEOFON network at the GFZ in Potsdam. Those stations were not built to listen for collapsing Arctic mountains. They were built to study earthquakes and the deep structure of the Earth. They picked up the Dickson Fjord event because high-quality long-period instruments record everything that moves the ground, regardless of what put it there. Whether the broadband seismic network will retain the funding to keep recording everything that moves the ground, through the next decade and the next, as the Arctic warms and the cascade lengthens, is a separate question that does not have a settled answer.
Dave Petley, writing for the Eos Landslide Blog, called the work a fabulous piece of science: accurate and understated. NASA Earth Observatory’s image-of-the-day feature on the SWOT confirmation said it differently: this is the first time a satellite has watched a seiche from orbit, and it will not be the last.
The last word should go to Hicks and Svennevig, from the closing paragraph of their Conversation essay. They had spent eleven months building a model of a fjord that rings, with sixty-six colleagues across fifteen countries, and they were entitled to a louder finish than the one they wrote:
“Traditionally, discussions about climate change have focused on us looking upwards and outwards to the atmosphere and to the oceans with shifting weather patterns, and rising sea levels. But Dickson Fjord forces us to look downward, to the very crust beneath our feet. For perhaps the first time, climate change has triggered a seismic event with global implications. We found a nine-day wave that previously no one could imagine could exist.”
Somewhere in the seismometer archives, the older signals are still there, waiting for somebody to go looking.
Frequently Asked Questions
What caused the Dickson Fjord landslide in 2023?
Decades of glacial thinning. A small gully glacier at the foot of Hvide Støvhorn lost up to 27 metres of ice between 1985 and 2018, removing support from a foliation-controlled rock slope above. When the slope finally failed on 16 September 2023, 25 million cubic metres of rock and ice plunged into the fjord.
How tall was the Dickson Fjord tsunami?
The initial backsplash threw water 200 metres up the opposite cliff. Secondary waves reached 110 metres against various sections of the fjord wall. Seventy-two kilometres away, the tsunami arrived at Ella Ø as a 4-metre wave that inundated up to 80 metres inland.
Why did the seismic signal last nine days?
Dickson Fjord acted as a resonator. The narrow, deep fjord geometry trapped a standing wave, a seiche, between its two walls, oscillating at a 92-second period. With very little energy loss to friction, the seiche took nine days to decay below the seismic detection threshold.
Was the Dickson Fjord event caused by climate change?
Yes, directly. The glacier that buttressed the rock slope had been thinning since at least 1985 as the Arctic warmed. The chain from atmospheric warming to glacier retreat to slope debuttressing to catastrophic failure is documented in the Svennevig et al. 2024 Science paper.
Could a Dickson Fjord-type event happen again?
It already has. On 10 August 2025, a 64-million-cubic-metre rockslide at Tracy Arm in Alaska produced a 481-metre tsunami runup and a 36-hour global seiche signal, the second days-long fjord seiche ever recorded. Similar instabilities at Karrat Fjord (Greenland) and Barry Arm (Alaska) are actively monitored.
What is a seiche?
A seiche is a standing wave in an enclosed or partially enclosed body of water. Like water sloshing back and forth in a bathtub, the wave reflects between the basin’s walls instead of radiating away. Seiches can last from minutes to days depending on the basin’s geometry and the strength of the initial disturbance.