Introduction
How do we know what’s inside the Earth? Mostly from earthquakes. Seismic waves cross the whole planet, and the way they speed up, slow down, bend and vanish maps a layered interior: crust, mantle, liquid outer core, solid inner core. Earth’s density, its magnetic field, meteorites, scraps of mantle rock carried up by volcanoes and high-pressure experiments point to the same structure.
Nobody has been there. The deepest hole ever drilled, the Kola Superdeep Borehole in Arctic Russia, reached 12,262 metres, about 0.2 percent of the way to the centre.
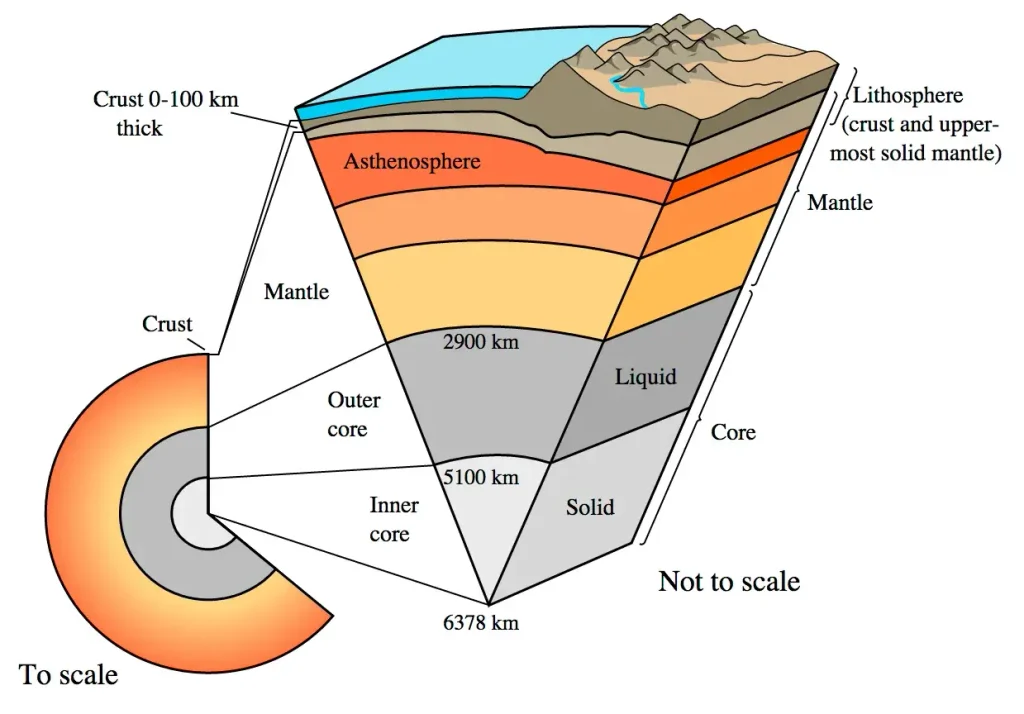
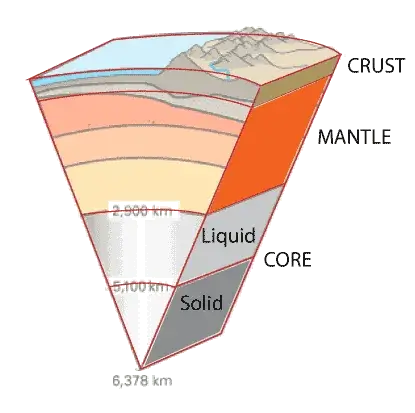
Cutaway views of Earth’s interior. Left: a to-scale drawing showing how thin the crust is. Right (not to scale): the three main compositional layers (crust, mantle and core). Credit: U.S. Geological Survey, public domain.
Oatmeal boxes in a Danish garden
A relative, Nils Groes, later recalled seeing the Danish seismologist Inge Lehmann one summer Sunday in her garden, sitting on the lawn at a big table covered with cardboard oatmeal boxes. The boxes held cards, each recording when the waves from an earthquake had reached seismograph stations around the world. There were no computers, and Lehmann compared the readings herself. The cards held a problem. Faint P-waves, the fast, first-arriving pulses from distant earthquakes, kept turning up at stations where the accepted model of the Earth said none should arrive. They were landing inside the shadow zone, a band of the surface that a single core should have left dark.
Lehmann’s answer was a second boundary. Inside the core, she proposed, sits a smaller inner core in which waves travel faster, and that inner core deflects some of them up into the shadow. She published the idea in 1936 in a paper whose entire title is “P′” (P-prime), the seismologists’ label for P-waves that have crossed the core. “In it she wrote that “inside the core there is an inner core in which the velocity is larger than in the outer one.” She offered it as a hypothesis that her data could not prove, and she did not claim the inner core was solid. That came later.

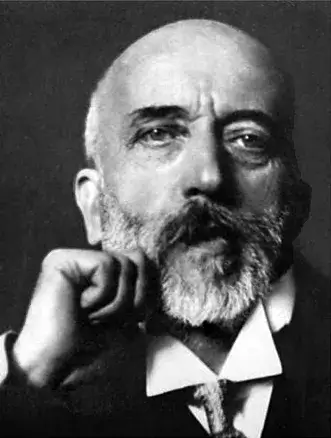
Inge Lehmann (1888–1993), photographed in 1932. Working by hand from seismograph readings, she inferred Earth’s inner core in her 1936 paper “P′”. Credit: The Royal Library, National Library of Denmark and Copenhagen University Library, via Wikimedia Commons (public domain in Denmark).
Lehmann’s inner core was the last piece of a structure that took thirty years to assemble. The planet is 6,371 kilometres in radius, and the deepest drill hole reaches about 12. Yet seismologists describe a solid metal ball that begins 5,150 kilometres down and is about as hot as the surface of the Sun. They can do it because earthquakes send sound-like waves through the whole planet, and Lehmann, along with a few scientists before and after her, learned to read what those waves had passed through.
(For the wider picture of how geologists read the planet, see Geoscopy’s overview, Geology, Explained.)
How deep have humans drilled into the Earth?
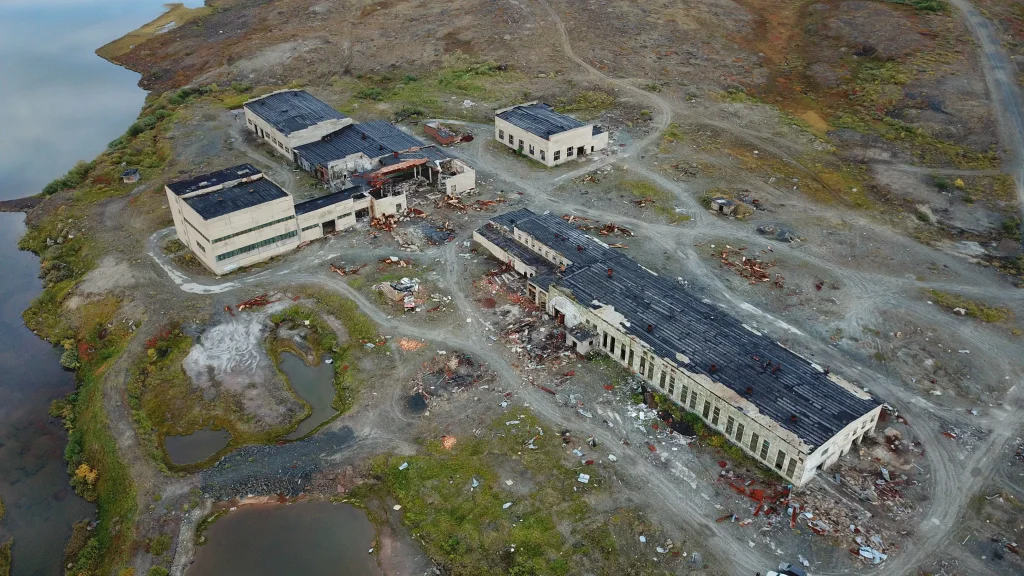
The Kola Superdeep Borehole (official designation SG-3) sits on Russia’s Arctic Kola Peninsula, near the Norwegian border. Drilling began on 24 May 1970, and in 1989 the hole reached its record depth of 12,262 metres (40,230 feet). No vertical hole has gone deeper since. The closest, China’s Shenditake 1 in the Tarim Basin, stopped at 10,910 metres in February 2025. The Kola shaft is about 23 centimetres wide, narrower than a dinner plate.
Heat stopped it. Soviet geophysicists had expected about 100 °C at that depth and measured about 180 °C. At that temperature the 2.7-billion-year-old rock at the bottom stopped behaving like a brittle solid and began to creep like plastic, closing in on the hole and deforming bits and pipe. The last deep attempt was abandoned in 1992 at 11,882 metres. A final branch, begun in 1994, ran out of money within months. The project was closed in 1995 and the site abandoned in 2008, its wellhead welded shut.
Set against a radius of 6,371 km, those 12.262 km are 0.2 percent of the way to the centre. If the Earth were shrunk to the size of an apple, Kola would not have broken through the skin. The Soviets were not aiming for the mantle. They wanted to study the deep continental crust, and the hole stalled a third of the way through it.
The United States had tried the shorter route in 1961 with Project Mohole, using the drilling barge CUSS I to bore into thin oceanic crust off Guadalupe Island, Mexico. In about 3,600 metres of water it drilled 183 metres into the sea floor and brought up 13 metres of basalt from beneath the sediment. The project showed that a ship could hold position over a deep-water drill site. Congress cancelled it in 1966, long before it reached the mantle.
How seismic waves reveal what’s inside the Earth
When an earthquake ruptures a fault, it releases energy as seismic waves that spread out through the Earth in every direction from the point of rupture (the hypocentre or focus). Two kinds of these travel through the planet’s body, and the difference between them is what makes the method work.
- P-waves (primary, or pressure, waves) are compressional. The rock squeezes and stretches back and forth in the same direction the wave is travelling, like a sound wave in air. They are the fastest waves, so they arrive first, and they can travel through solids, liquids and gases.
- S-waves (secondary, or shear, waves) are transverse. The rock shakes side to side, perpendicular to the wave’s direction of travel, like the wobble you send down a shaken rope. They are slower than P-waves, and they cannot travel through liquids, because a liquid has no rigidity to “shear” against.
Two behaviours turn these waves into a scanner. First, their speed depends on the rock. Stiffer, less compressible rock carries them faster, and density on its own slows them down. With depth, pressure stiffens rock faster than it packs it, so speeds generally rise. A P-wave travels at about 6 km/s in the granitic upper crust, about 7 km/s at the base of the crust and about 8 km/s just beneath it, in the top of the mantle.
Second, when a wave crosses a boundary where its speed changes, it bends (refracts), following the same Snell’s-law geometry that bends light entering water. It can also reflect. Every internal boundary therefore leaves a mark in the records: waves arrive earlier or later than expected, or fail to arrive. With many earthquakes recorded at many stations, those marks add up to a picture of the interior, much as a medical CT scan builds an image from many X-ray paths. Seismic tomography applies the same idea in three dimensions, mapping regions where waves run slightly fast or slightly slow.
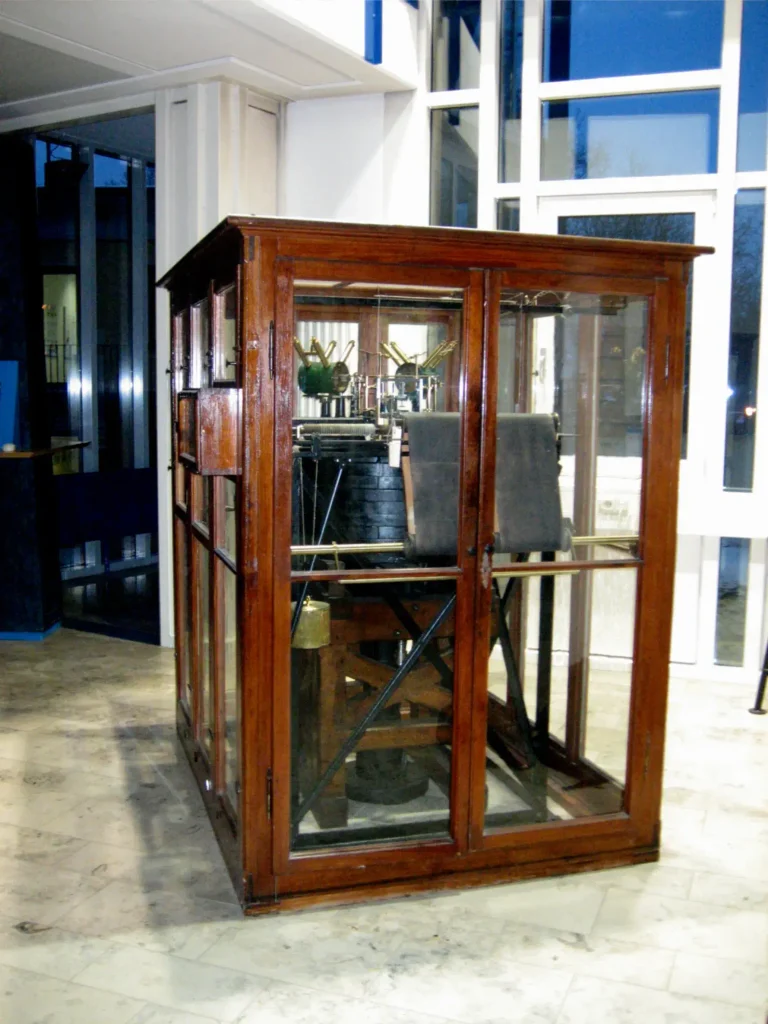
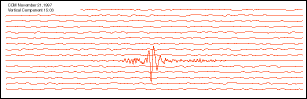
The recording itself is called a seismogram, the jagged trace of ground motion over time. On a single seismogram from a distant quake you can often see the P-waves arrive first, then the S-waves, then the slower surface waves. The gap between the P and S arrivals tells you how far away the earthquake was, and the exact shape and timing of every wiggle encodes what the waves passed through on the way. Lehmann’s oatmeal boxes were full of these timings.
What is the seismic shadow zone?
A seismic shadow zone is a part of Earth’s surface that certain waves from a given earthquake never reach. Direct P-waves are missing between about 104° and 140° from the earthquake because the core bends them away. Direct S-waves are missing everywhere beyond about 104° because they cannot cross the liquid outer core. Because waves refract sharply at the core, a large earthquake casts “shadows” on the far side of the planet, rings of the surface where certain waves never arrive. Seismologists measure position in angular distance: the angle, measured at Earth’s centre, between the earthquake and the recording station (0° is right on top of the quake, 180° is the exact opposite side).
According to the U.S. Geological Survey and the IRIS/EarthScope seismology resources, the pattern is precise:
- The P-wave shadow zone is the ring between about 104° and 140° from the earthquake. Direct P-waves do not arrive there because they are refracted sharply inward, bent downward, when they strike the core-mantle boundary and slow abruptly.
- The S-wave shadow zone is far larger: beyond about 104°, no direct S-waves appear anywhere on the far side of the planet.
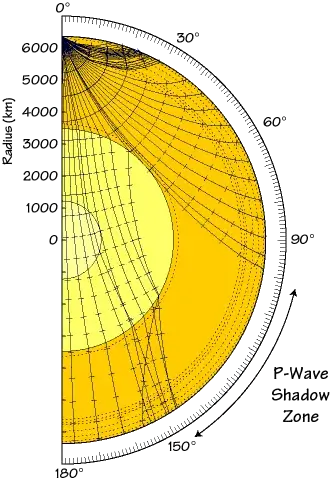
The S-wave shadow is so much bigger because S-waves cannot cross the outer core. A shear wave has nothing to shear in a fluid, so it stops at the core-mantle boundary. P-waves, which liquids do transmit, make the crossing but are bent, which leaves them the narrower shadow ring. Today the missing S-waves are the textbook evidence that the outer core is liquid. In the 1910s and 1920s they did not settle the matter. Most seismologists still took the core to be solid, and it was an argument from Earth’s tides, made by Harold Jeffreys in 1926, that changed their minds.
Seismologists label the more complicated paths with a shorthand worth knowing if you are studying for an exam: P is a P-wave in the mantle, K is a P-wave through the liquid outer core (from the German Kern, “core”), I is a P-wave through the inner core, and i is a reflection off the inner-core boundary. So a PKIKP wave punches down through the mantle, through the outer core, straight through the solid inner core, and back out again. These deep-diving phases are the ones Lehmann tracked into the shadow.
Who discovered Earth’s layers? Five names, thirty years
The modern picture of Earth’s interior was assembled boundary by boundary over three decades of the early twentieth century, as seismographs spread across the globe and a handful of scientists learned to interpret them.
1906: Richard Dixon Oldham finds the core
The Dublin-born geologist Richard Dixon Oldham had been the first to pick out P-waves, S-waves and surface waves as separate arrivals on seismograms, in his report on the 1897 Assam earthquake. Comparing records from many earthquakes, he then noticed that waves reaching the far side of the planet were late, as if they had crossed a central region where they slowed down. He published the result in 1906, and it is now regarded as the first clear seismic evidence that the Earth has a core. The idea of a dense centre was older. Emil Wiechert had argued in 1897 that only an iron core could explain the planet’s high density. Oldham supplied the seismic evidence.
1909: Andrija Mohorovičić discovers the Moho
On 8 October 1909 an earthquake struck the Kupa Valley near the village of Pokupsko, about 40 km south of Zagreb, Croatia. Andrija Mohorovičić, who ran the meteorological observatory in Zagreb and had recently installed sensitive Wiechert seismographs, collected records from 41 stations across Europe. Studying the records, he saw something odd at intermediate distances: two sets of P-waves and S-waves, one arriving faster than the other.
Stations near the epicentre received only waves that had travelled directly through the crust. From about 300 km outward a second, faster set appeared, and it reached the more distant stations first. These waves had dived down, met a layer where velocity jumped, refracted along it and come back up. P-wave speed rose from under 6 km/s in the crust to about 8 km/s in the layer beneath. Mohorovičić had found the boundary between the crust and the mantle, now called the Mohorovičić discontinuity, or Moho, which he placed 54 km below the surface.
1913: Beno Gutenberg measures the depth of the core
The German-American seismologist Beno Gutenberg took Oldham’s core and measured it. In 1913 he determined the depth of the core-mantle boundary, the sudden change where S-waves vanish and P-waves slow, at about 2,900 km below the surface. That boundary is now often called the Gutenberg discontinuity, and modern values place it at 2,890–2,891 km. Density jumps there from roughly 5.5 g/cm³ at the base of the mantle to nearly 10 g/cm³ at the top of the core.

1926: Harold Jeffreys shows the core is liquid
Textbooks often say the missing S-waves proved the core is liquid. At the time they persuaded few seismologists, and Gutenberg himself held for years that the core was solid. The argument that settled it came from the British geophysicist Harold Jeffreys in 1926. Tides in the solid Earth show how rigid the planet is as a whole, and seismic wave speeds show how rigid the mantle is. The mantle turned out to be stiffer than the whole-Earth average, so whatever lies beneath it must have almost no rigidity. Jeffreys concluded that the core is fluid.
1936: Inge Lehmann discovers the inner core
The records that mattered most to Lehmann came from a large earthquake near Murchison, New Zealand, in June 1929, picked up by stations in Europe and Greenland most of the way around the globe. In them she found P-waves arriving in the shadow zone that a single core could not explain. Her 1936 paper “P′” showed that an inner core with a higher wave speed would deflect waves to the places where she saw them. Her simple model gave it a radius of about 1,400 km. Two years later Beno Gutenberg and Charles Richter refined the figure to about 1,200 km, close to the modern 1,220 km. The boundary between inner and outer core, at roughly 5,150 km depth, is often called the Lehmann discontinuity in her honour.
Exam note: beware the two Lehmann discontinuities. Confusingly, Lehmann’s name is attached to two different features. One is the inner-core/outer-core boundary at ~5,150 km (the sense used above). The other, which she also discovered later, is a seismic velocity jump in the upper mantle at roughly 190–250 km depth. If a question mentions the “Lehmann discontinuity,” check whether it means the deep core boundary or the shallow mantle one.
Solidity came later. Francis Birch in 1940 and K. E. Bullen in 1946 argued from the physics of compression that the inner core should be solid. In 1970 seismologists recorded waves reflecting off its boundary, and in 1971 Adam Dziewonski and Freeman Gilbert confirmed a solid centre from Earth’s free oscillations, the way the whole planet rings like a bell for days after a giant earthquake. Seismologists have since reported the faint shear waves, labelled PKJKP, that only a solid inner core can carry.
Earth’s layers in order: by composition and by behaviour
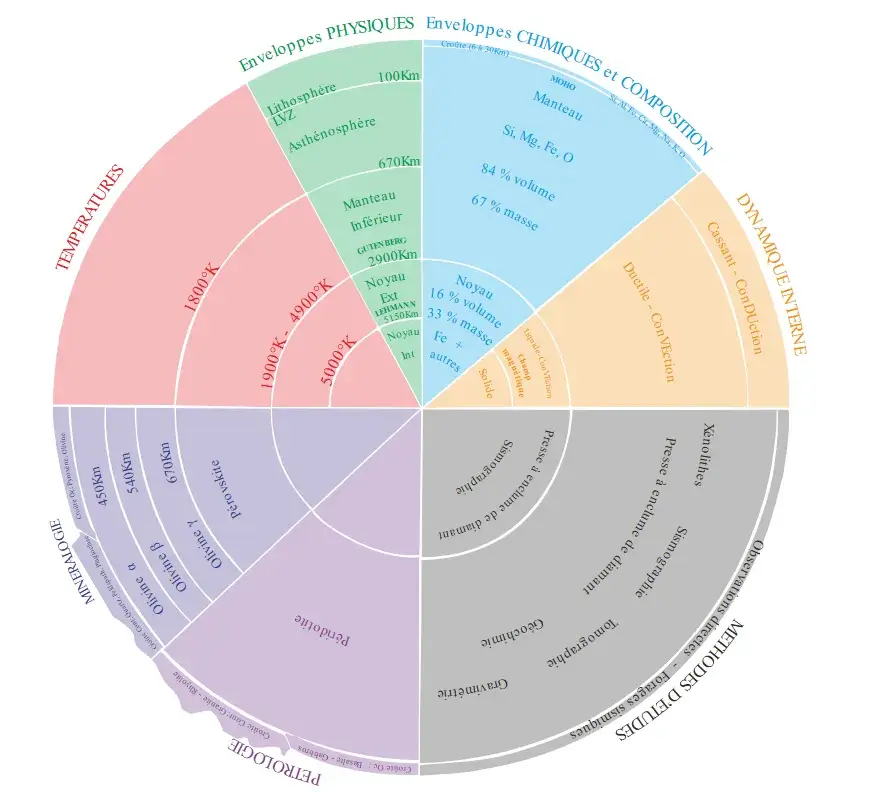
From the surface down, Earth’s layers by composition are the crust (5–70 km thick), the mantle (down to about 2,890 km) and the core (to the centre at 6,371 km). By mechanical behaviour they are the lithosphere, the asthenosphere, the stiffer lower mantle or mesosphere, the liquid outer core and the solid inner core.
The two schemes do not line up, which trips up students constantly. One scheme is based on what the layers are made of (chemistry). The other is based on how the layers behave (whether they are rigid, ductile or liquid). Both are correct; they are just answering different questions.
By composition: crust, mantle and core
- Crust the thin outer rind. Oceanic crust is dense basalt, only about 5–10 km thick. Continental crust is lighter, granitic rock averaging 30–40 km thick and reaching up to about 70 km under great mountain belts like the Himalaya. The crust is a rounding error in the planet’s bulk.
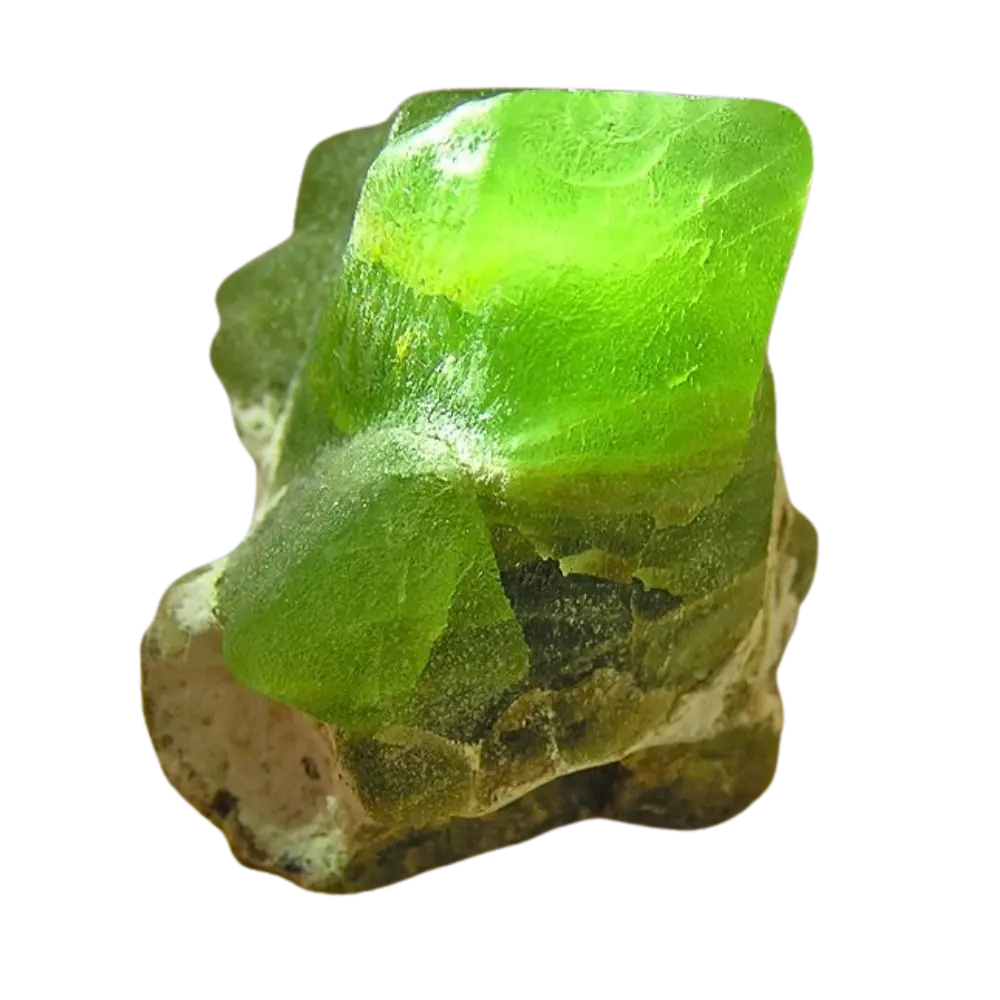
- Mantle silicate rock rich in magnesium and iron (olivine-rich peridotite in the upper mantle, the denser mineral bridgmanite in the lower mantle), extending from the Moho down to about 2,890 km. It holds about 84 percent of Earth’s volume.
- Core an iron-nickel alloy (with some lighter elements) from 2,890 km to the centre at 6,371 km. Liquid on the outside, solid at the very centre.
By mechanical behaviour: lithosphere, asthenosphere, mesosphere and core
- Lithosphere the cold, rigid outer shell, about 100 km thick on average. It includes the crust plus the uppermost mantle. This is the layer broken into the tectonic plates. (Note that the lithosphere is a mechanical layer that crosses the crust-mantle chemical boundary, which is why the two schemes confuse people.)
- Asthenosphere the weak, ductile part of the upper mantle, beneath the lithosphere. Its lower limit is not sharply defined and is often put at the base of the upper mantle, about 660 km down. It is solid rock, but hot enough to flow slowly, like extremely stiff putty, over geological time. The plates ride on it. The name comes from the Greek asthenes, “weak.”
- Mesosphere (lower mantle) solid mantle from about 660 km to 2,890 km. Between 410 and 660 km lies the transition zone, where olivine changes into denser crystal structures.
- Outer core the only liquid layer, 2,890–5,150 km. Its churning, electrically conducting iron generates Earth’s magnetic field. At the core-mantle boundary a change in composition and a change in mechanical state coincide: solid silicate rock above, liquid metal below.
- Inner core solid iron-nickel from 5,150 km to the centre, radius about 1,220 km.
Earth’s layers at a glance
| Layer (composition) | Depth range | State | Made of | Mechanical name |
|---|---|---|---|---|
| Crust | 0–~10 km (ocean) / 0–~70 km (continent) | Solid, brittle | Basalt / granite | Part of lithosphere |
| Upper mantle | Moho–660 km (transition zone 410–660 km) | Solid (upper part flows) | Peridotite / olivine | Lithosphere (top) + asthenosphere |
| Lower mantle | 660–2,890 km | Solid, stiff | Silicate (bridgmanite) | Mesosphere |
| Outer core | 2,890–5,150 km | Liquid | Iron-nickel | Outer core |
| Inner core | 5,150–6,371 km | Solid | Iron-nickel | Inner core |
The three great discontinuities (an exam-friendly summary)
- Mohorovičić discontinuity (Moho) crust/mantle boundary. Discovered by Mohorovičić, 1909. Depth ~5–10 km (ocean) to ~30–70 km (continents). Marked by a P-wave velocity jump from about 7 km/s in the lowest crust to about 8 km/s in the uppermost mantle.
- Gutenberg discontinuity mantle/outer-core boundary. Depth ~2,890 km. Discovered by Gutenberg, 1913. S-waves stop here; P-waves slow sharply; density jumps from ~5.5 to ~10 g/cm³.
- Lehmann discontinuity outer-core/inner-core boundary. Depth ~5,150 km. Discovered by Lehmann, 1936. (Remember the separate upper-mantle “Lehmann discontinuity” at ~190–250 km.)
Why Earth’s Outer Core Is Liquid and Its Inner Core Is Solid
The inner core is solid because of pressure. Both parts of the core are roughly the same iron-nickel alloy, and iron’s melting point rises steeply as pressure rises. In the outer core the temperature is above the melting point, so the metal is liquid. Deeper down the melting point overtakes the temperature, and the iron freezes.
What matters at any depth is whether the local temperature sits above or below the melting point at that pressure, and the melting point is not fixed (a consequence of the Clausius–Clapeyron relation). At the centre the pressure reaches about 360 gigapascals, over three million times atmospheric pressure. The melting point there is higher than the temperature, even though the temperature is higher than anywhere else in the planet.
The inner core is still growing. As the Earth loses heat, liquid iron at the inner-core boundary crystallises onto the solid ball, whose radius grows by about a millimetre a year on average. The light elements left behind stir the outer core and help power the magnetic field.
How hot is Earth’s core?
The boundary between Earth’s inner and outer core is at roughly 5,000–6,000 °C, about as hot as the surface of the Sun. Nobody can measure it directly. The figure comes from laboratory measurements of the temperature at which iron melts under core pressures, and published values still differ by several hundred degrees.
We cannot put a thermometer in the core, so we bracket its temperature by measuring, in the laboratory, the melting point of iron at core pressures, because at the inner-core boundary the temperature must equal the melting point of the core alloy (that is where liquid meets solid), and the melting point of pure iron sets an upper limit. To reach those pressures, physicists squeeze tiny samples between the tips of two gem-quality diamonds in a diamond-anvil cell, then heat them with lasers and watch how they behave with X-rays.
The results still disagree by several hundred degrees. In 2013 Simone Anzellini and colleagues, writing in Science, tracked the melting of iron with fast X-ray diffraction in a laser-heated diamond-anvil cell up to 200 GPa. Extrapolating to the 330 GPa of the inner-core boundary, they obtained 6,230 ± 500 K (about 5,500–6,500 °C). In 2019 Sinmyo and colleagues used an internally resistance-heated cell, reached 290 GPa and arrived at 5,500 ± 220 K (about 5,000–5,450 °C).
The light elements dissolved in the real core lower the melting point further. Estimates for the inner-core boundary therefore cluster around 5,000–6,000 °C, comparable to the surface of the Sun. A single confident number quoted elsewhere deserves caution, because the measurement is still being refined.
Five lines of evidence besides seismic waves
Seismology is the backbone, but it is not the only witness. Five other lines of evidence, most of them independent of earthquakes, point to the same layered, iron-cored Earth.
1. Density and moment of inertia
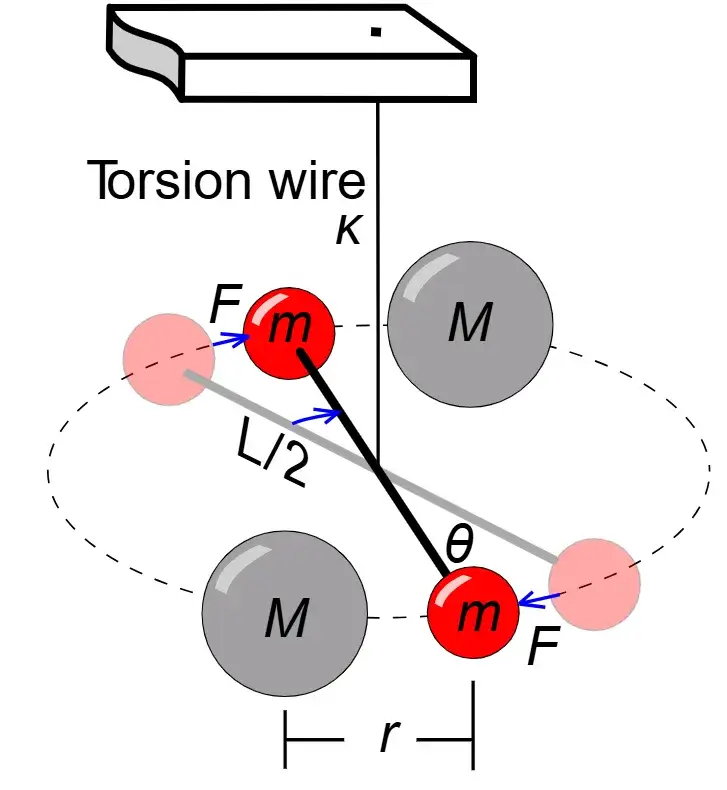
Earth’s mean density is about 5.51 g/cm³. But the rocks we walk on, granite and basalt, have densities of only 2.7–3.0 g/cm³. The whole planet is nearly twice as dense as its surface, so something much heavier must lie inside. That was Wiechert’s argument in the 1890s, resting on Henry Cavendish’s 1798 torsion-balance experiment, which gave the planet’s mean density as 5.48 times that of water.
A second, subtler clue is the moment of inertia, a measure of how mass is distributed relative to the spin axis, read from the slow precession of Earth’s spin axis and from the orbits of satellites. For a uniform sphere the moment-of-inertia factor would be 0.4. Earth’s value is about 0.331 (more precisely 0.3307). A number below 0.4 means mass is concentrated toward the centre. Together, the density and the moment of inertia require a dense core, and an iron-rich core of the size seismology finds fits both numbers.
2. Meteorites
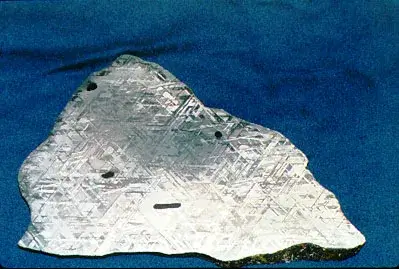
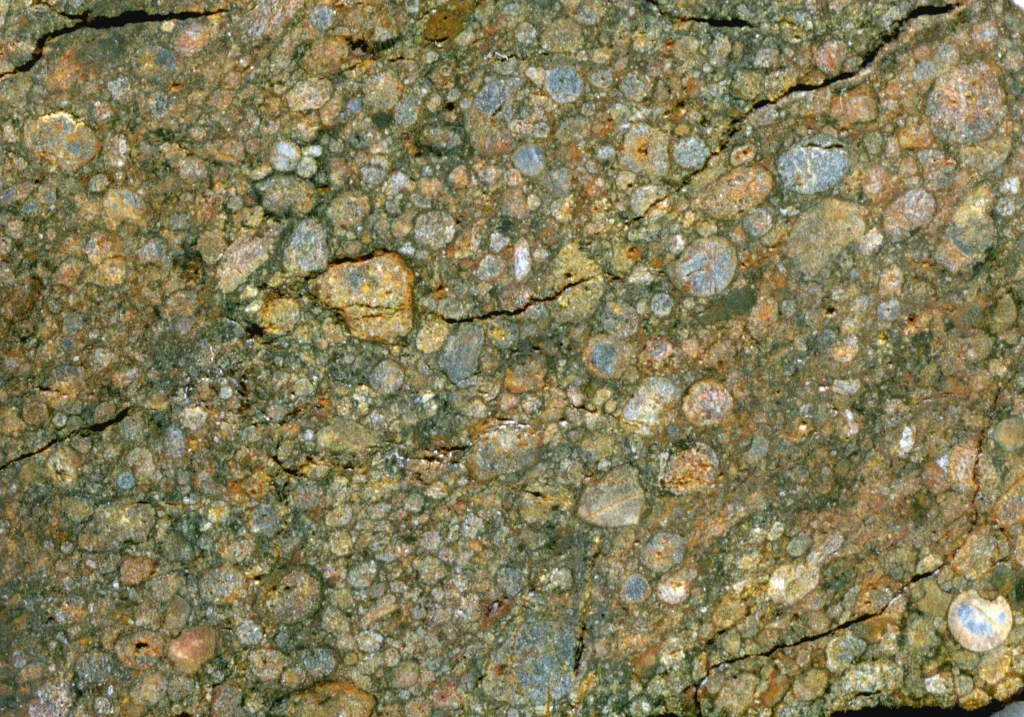
The Solar System’s planets condensed from the same cloud of dust that produced the meteorites we find today. Chondrites, primitive stony meteorites, approximate the bulk composition of the raw material that built the rocky planets. Most iron meteorites are fragments of the metallic cores of asteroids that grew large enough to melt and separate into a rock mantle and an iron core, then shattered. They show that iron-nickel cores form naturally in rocky bodies. They also suggest why Earth’s core should be iron and not some other dense metal: iron is far more abundant in meteorites and in the Sun than any other heavy element.
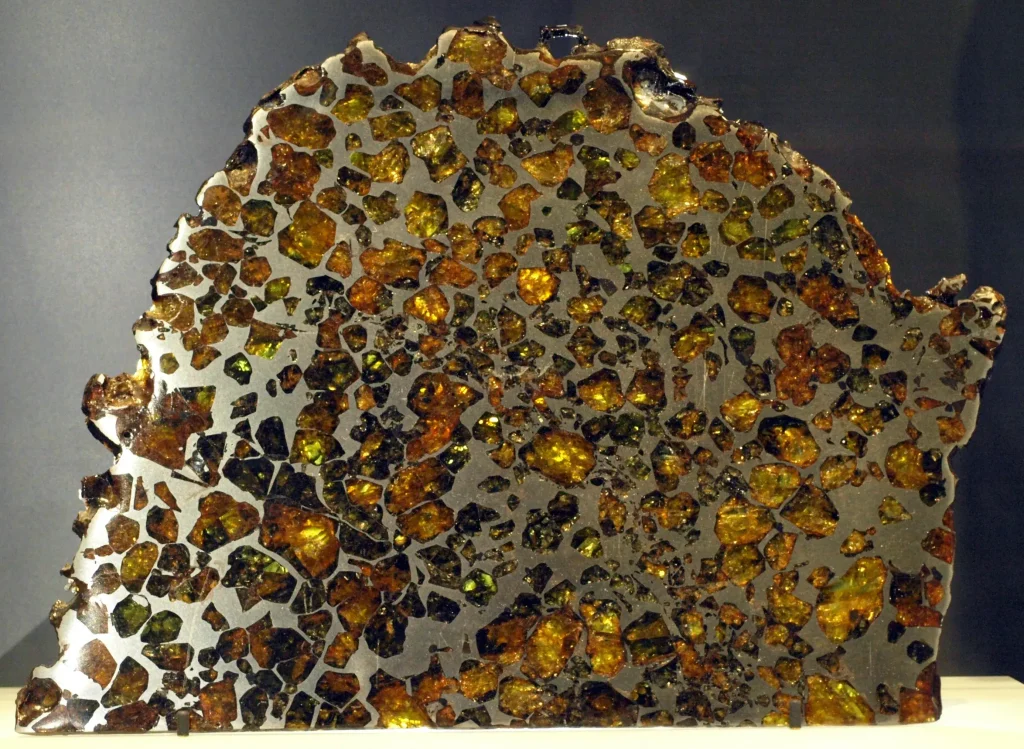
Pallasites, meteorites of olivine crystals set in iron-nickel metal, mix core and mantle material. They were long read as samples of an asteroid’s core-mantle boundary. Magnetic measurements published in Science in 2012 by John Tarduno and colleagues, on pallasites including Esquel, point instead to molten core metal injected into a mantle during a collision, and the origin is still debated.
3. The Geomagnetic Dynamo: Evidence From Earth’s Core
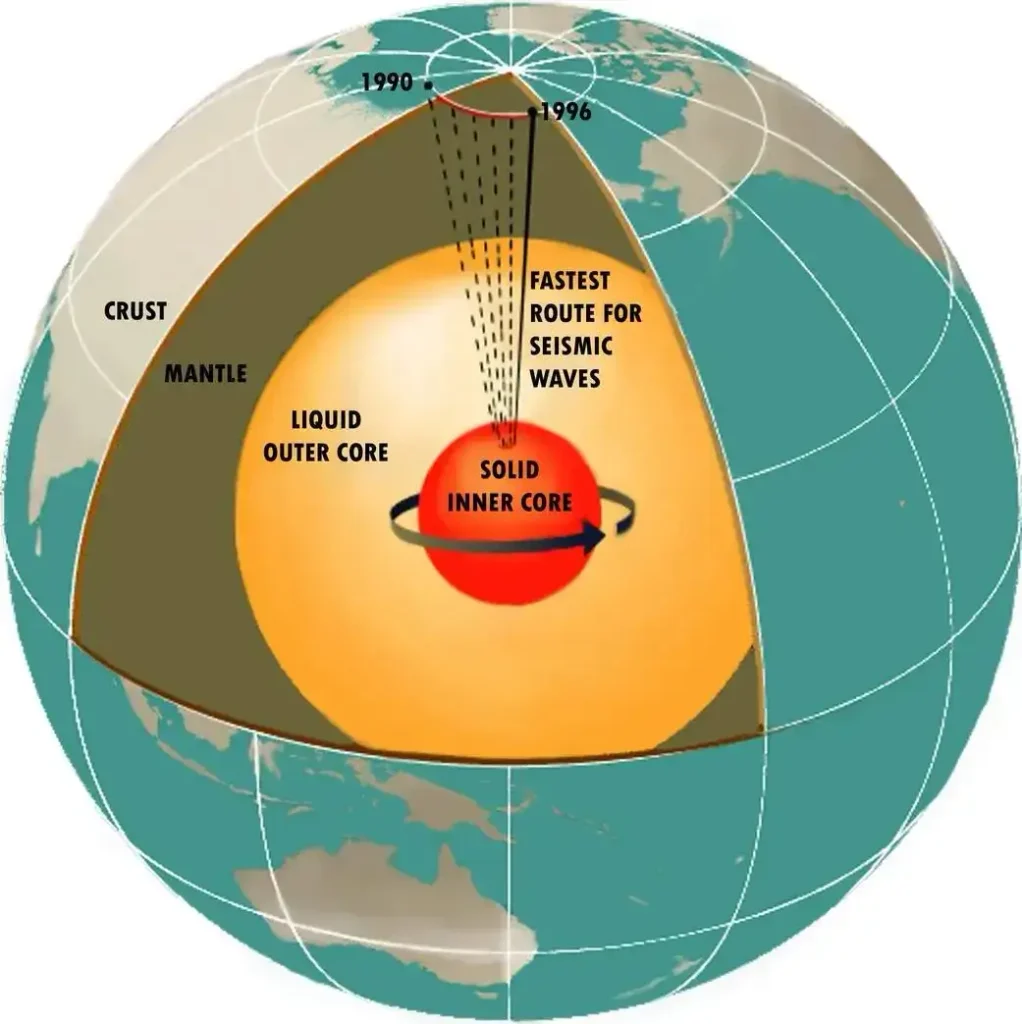
Earth has a global magnetic field, and it cannot come from a permanent magnet, because the interior is far too hot to stay magnetised. The field is generated by the geodynamo. Liquid iron in the outer core convects, the planet’s rotation (through the Coriolis force) organises the flow into rolls, and the moving conductor generates electric currents that sustain the field. That requires a large volume of moving, electrically conducting fluid, which is what a liquid iron outer core provides.
In 1995 Gary Glatzmaier and Paul Roberts published the first self-consistent three-dimensional computer simulation of the geodynamo. Over 40,000 simulated years it maintained a field dominated by a dipole, and near the end of the run the dipole reversed. It showed that a convecting liquid-iron core can behave the way Earth’s field does.
4. Pieces of the mantle at the surface
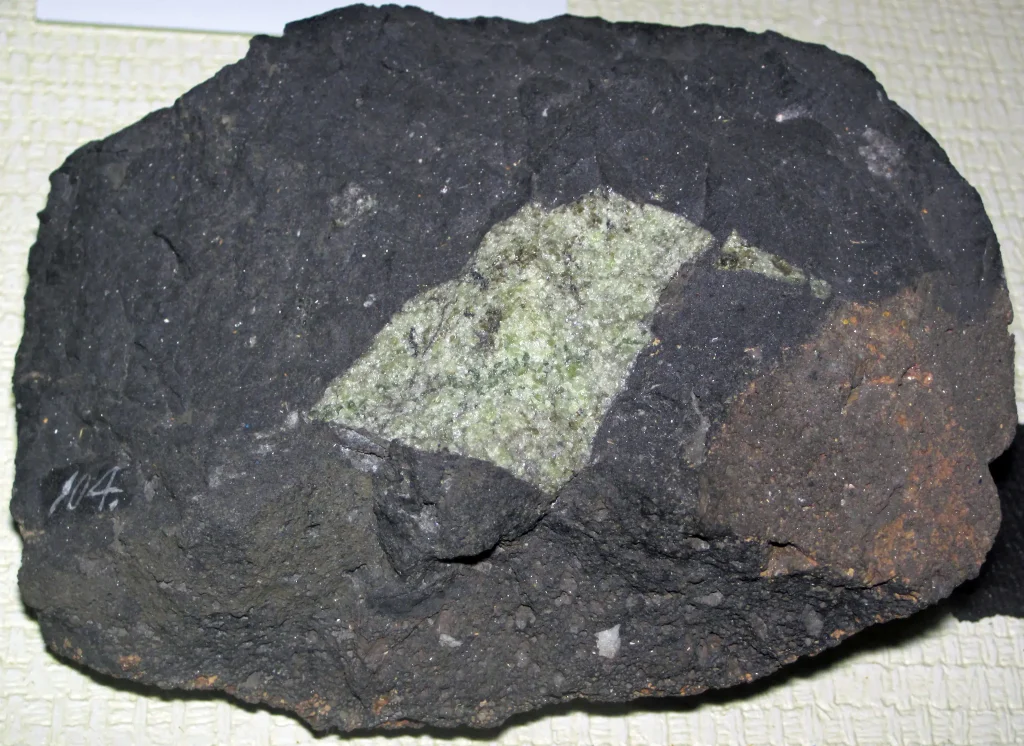
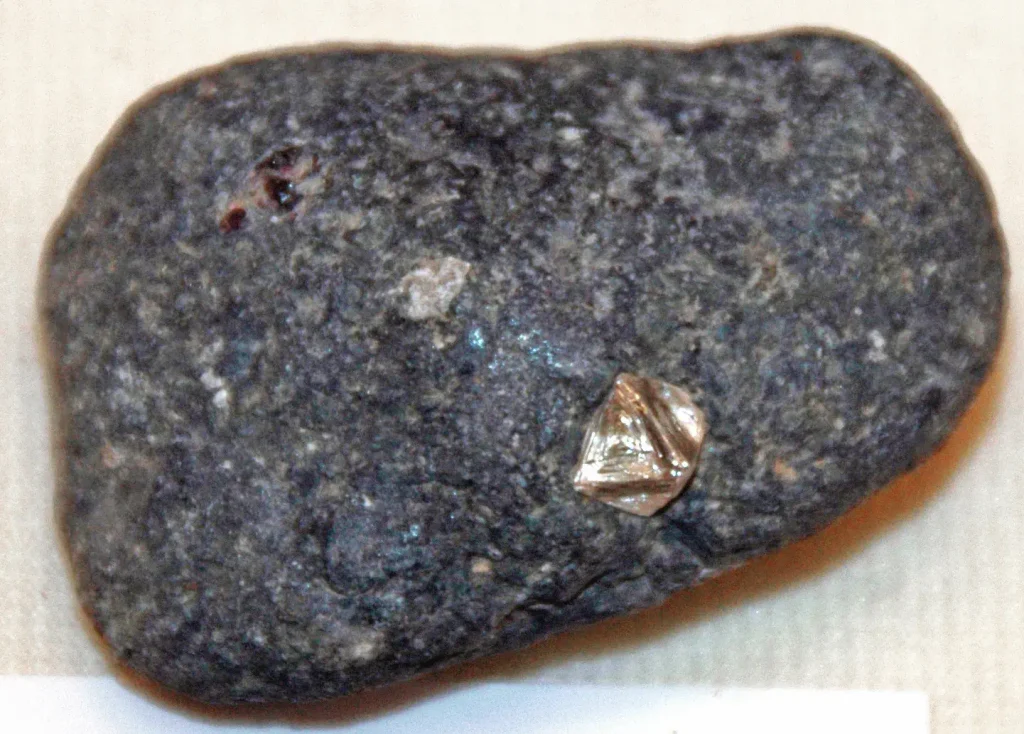
No drill has crossed the Moho, but the mantle occasionally delivers itself to us. Deep volcanic eruptions of kimberlite tear upward from more than 150 km down so fast that they rip out chunks of mantle rock and carry them to the surface intact. These fragments, called xenoliths (Greek for “foreign rocks”), are typically peridotite, the olivine-rich rock that makes up the upper mantle. More than 300 xenoliths from seven kimberlites at the Ekati diamond mine, on Canada’s Slave craton (a block of ancient continental crust), give a profile of the mantle from less than 120 km down to about 200 km. The diamonds those same kimberlites carry are themselves messengers from the deep: beneath old continental interiors diamond is stable only below about 130–150 km, so almost every natural diamond has been to the mantle and back. (The exceptions include tiny diamonds made at the surface when a meteorite impact shocks graphite, as at Popigai in Siberia.)
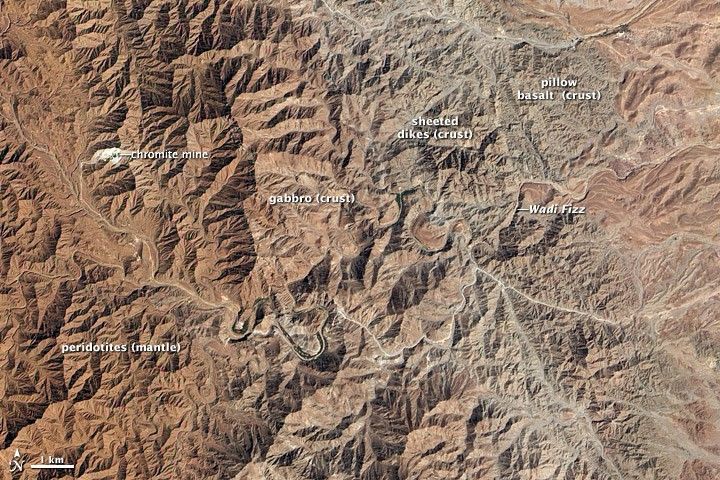
A different route exposes the oceanic mantle: ophiolites, slices of old oceanic crust and the mantle beneath it that have been thrust up onto land by plate collisions. The Semail ophiolite in the mountains of Oman is a classic example, where you can walk from ancient sea-floor basalt down into peridotite that was once part of the mantle.
5. High-pressure experiments
Diamond-anvil cells also recreate the pressures of the deep mantle. By recreating the pressures of the deep mantle and core, they let mineralogists discover which crystal structures silicate and iron adopt at depth, for example the mineral bridgmanite that dominates the lower mantle, and predict the seismic velocities those minerals should produce. Those predictions can then be checked against the velocities seismology measures.
Has anyone drilled into the mantle?
No one has drilled through intact crust into the mantle. Under continents the Moho lies 30–70 km down, far beyond any drill. Under the oceans it is only 5–10 km below the sea floor, but that sea floor lies under about 4 km of water, and a hole some 6 km deep must be kept from collapsing. Doing that means circulating drilling mud from the ship to the bit and back, which no research ship has yet managed at that water depth. That was Project Mohole’s goal, and it is still unmet. As of 2026 no drill has crossed the Moho.
Drills have reached mantle rock by a side door. At a few places on the mid-ocean ridges, faults have dragged mantle peridotite up to the sea floor. In spring 2023 the drill ship JOIDES Resolution bored 1,268 metres into one such exposure, the Atlantis Massif on the Mid-Atlantic Ridge, and recovered a nearly continuous core of mantle rock. It is altered by seawater, and it was not reached by crossing the crust. JOIDES Resolution was retired in 2024, when the International Ocean Discovery Program ended. A true Moho crossing is now an ambition of Japan’s Chikyū, which drills for the successor programme IODP³, and of China’s Meng Xiang, commissioned in November 2024 and built to drill 11 km below the sea surface.
The same method on Mars
The seismic method has now been tested on another planet. In 2018 NASA’s InSight lander placed an ultra-sensitive seismometer, called SEIS (the Seismic Experiment for Interior Structure), on the surface of Mars. Over its mission, which ended on 21 December 2022, it detected 1,319 marsquakes. Then, using a marsquake on 25 August 2021 and a meteoroid impact on 18 September 2021, both on the far side of the planet, whose waves travelled through the Martian core, scientists made what NASA and JPL called “the first direct observations ever made of another planet’s core.” As the study’s lead author, Jessica Irving of the University of Bristol, put it in NASA’s announcement, “We needed both luck and skill to find, and then use, these quakes.” The waves showed that Mars has a liquid iron-alloy core, smaller and denser than earlier InSight estimates. In September 2025 a team led by Huixing Bi and Daoyuan Sun reported in Nature that the same data also contain the phases PKKP and PKiKP, the Martian counterparts of the waves Lehmann studied, and that they reveal a solid inner core about 600 km in radius.
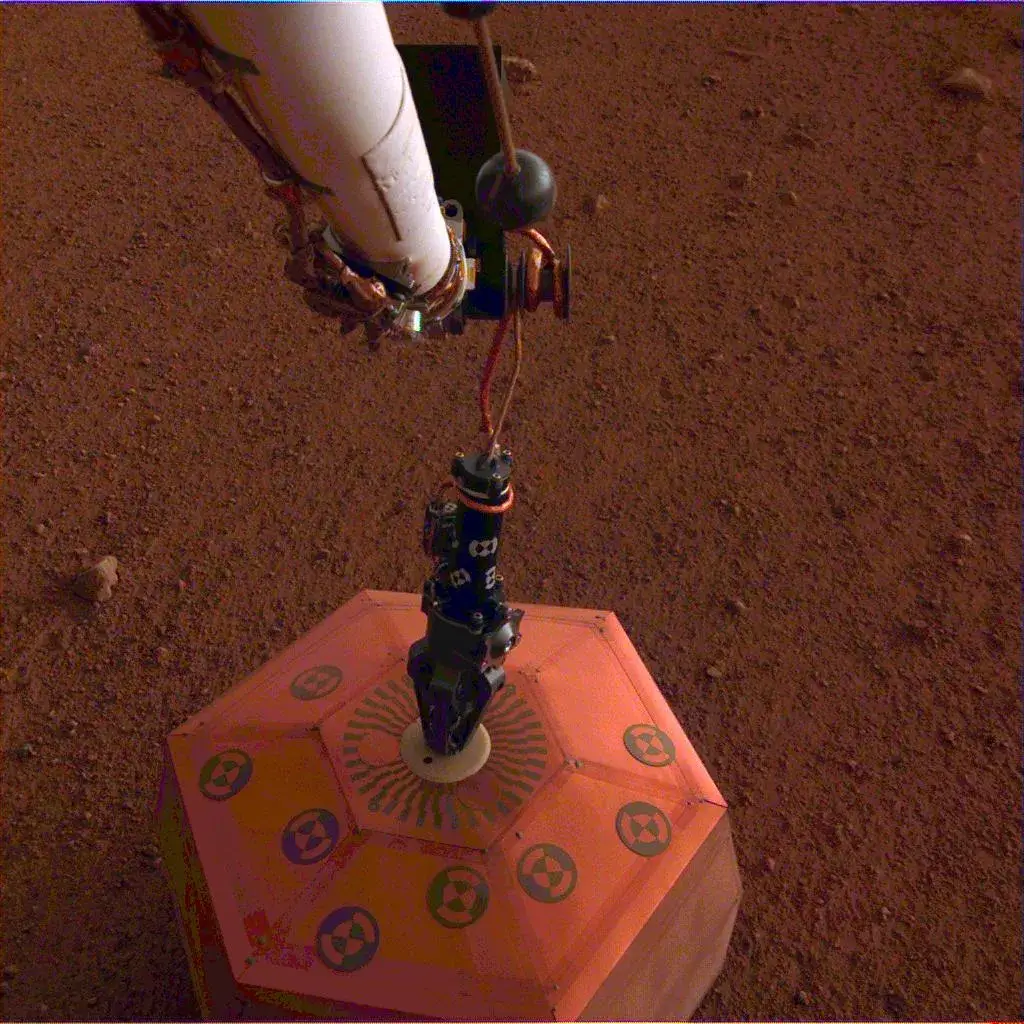
With a single seismometer, the method Lehmann and Gutenberg developed for Earth recovered the same kind of layered structure on Mars.
What scientists still argue about
The broad architecture (crust, mantle, liquid outer core, solid inner core) is settled. Two questions about the deep Earth are not.
Inner-core rotation. Because the solid inner core is suspended in liquid, it may rotate at a slightly different rate from the rest of the planet. In 1996, Xiaodong Song and Paul Richards reported seismic evidence for such “differential rotation.” In 2023 Yi Yang and Song reported in Nature Geoscience that seismic paths through the inner core, which had been changing for decades, had shown little change for about ten years. They read this as the inner core pausing and turning back relative to the mantle, one swing of an oscillation lasting about seven decades, with the previous turning point in the early 1970s. Other groups, including Hrvoje Tkalčić’s, dispute the period and the timing, and some have argued that the seismic changes come from a shifting inner-core surface rather than from rotation of the whole body. In February 2025 John Vidale’s team reported in Nature Geoscience that the rotation rate varies and that the outermost inner core also appears to deform.
LLSVPs. At the base of the mantle, seismic tomography reveals two continent-sized blobs where waves slow down, the large low-shear-velocity provinces, one beneath Africa and one beneath the Pacific. Whether they are piles of chemically distinct rock left from Earth’s formation or graveyards of subducted slabs is debated. Geoscopy surveys the candidates in LLSVPs: Hidden Giants at Earth’s Core-Mantle Boundary.
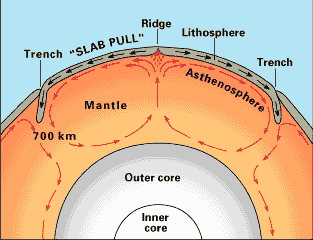
Mantle convection: hot rock rises, cools near the surface and sinks again, in a slow circulation coupled to the motion of the plates above and heated from the core below. Credit: U.S. Geological Survey, “This Dynamic Earth,” public domain.
For the timeline these layers belong to, see The Geologic Time Scale, Explained.
What Lehmann did not live to see
Lehmann lived to 104. In 1970 seismologists recorded waves reflecting off the inner-core boundary she had drawn, and in 1971 the free oscillations of the whole planet showed that the ball inside it is solid. She died in 1993, three decades before the same kind of reflection, now written PKiKP, was picked out of records from a single seismometer on Mars. The deepest hole on Earth still stops 6,359 kilometres short of the centre.
Frequently asked questions
How do scientists know what’s inside the Earth?
Indirectly, through several independent methods. The main one is seismology: waves from earthquakes travel through the whole planet, and the way they change speed, refract and disappear reveals the internal boundaries. On top of that, Earth’s mean density (5.51 g/cm³) and its moment-of-inertia factor (0.33) show the mass is concentrated in a dense core; meteorites reveal the raw ingredients; volcanoes bring up pieces of the mantle; the magnetic field requires a liquid-iron core; and diamond-anvil experiments recreate deep-Earth conditions in the lab. All these agree.
What are the Earth’s layers in order?
By composition, surface to centre: crust, mantle, outer core, inner core. By mechanical behaviour: lithosphere (rigid), asthenosphere (weak, flowing), mesosphere/lower mantle (stiff), outer core (liquid), inner core (solid). The two schemes describe the same planet but split it differently. The lithosphere, for instance, includes both the crust and the topmost mantle.
Why is the outer core liquid and the inner core solid?
Both are iron-nickel of similar composition; the difference is pressure. Iron’s melting point rises steeply with pressure. In the outer core, temperature exceeds iron’s melting point, so it is molten. At the centre, the pressure of about 360 GPa raises iron’s melting point above the local temperature, so the inner core stays solid even though it is hotter than the layer above it.
How deep have humans drilled?
The record is the Kola Superdeep Borehole in Arctic Russia, which reached 12,262 m (40,230 feet) in 1989. That is roughly one-third of the way through the local continental crust and only 0.2 percent of the way to Earth’s centre. Drilling stopped when the rock reached about 180 °C and began to flow.
What is the Moho?
The Moho, short for the Mohorovičić discontinuity, is the boundary between crust and mantle, where seismic waves suddenly speed up. Andrija Mohorovičić discovered it from the 1909 Kupa Valley earthquake in Croatia. It lies about 5–10 km deep under oceans and roughly 30–70 km deep under continents.
How hot is the core?
Estimates for the inner-core boundary cluster around 5,000–6,000 °C, about as hot as the surface of the Sun. A 2013 diamond-anvil study (Anzellini et al.) put iron’s melting point there at 6,230 ± 500 K; a 2019 study (Sinmyo et al.) gave about 5,500 ± 220 K. The exact figure is still an active measurement problem.
Who discovered Earth’s inner core?
The Danish seismologist Inge Lehmann, in a 1936 paper titled “P′”. She showed that faint P-waves arriving inside the core’s shadow zone, recorded after a 1929 earthquake near Murchison, New Zealand, could be explained by a smaller inner core with a higher wave speed. That the inner core is solid was argued by Francis Birch in 1940 and K. E. Bullen in 1946, and confirmed from Earth’s free oscillations in 1971.
How do we know Earth’s core is made of iron?
Several observations point the same way. Earth’s mean density (5.51 g/cm³) is about twice that of surface rock, and its moment-of-inertia factor (0.33) shows the extra mass sits at the centre. Iron meteorites show that rocky bodies form iron-nickel cores. Iron is also far more abundant in meteorites and the Sun than any other heavy metal, so it is the only candidate available in the quantity needed.”