

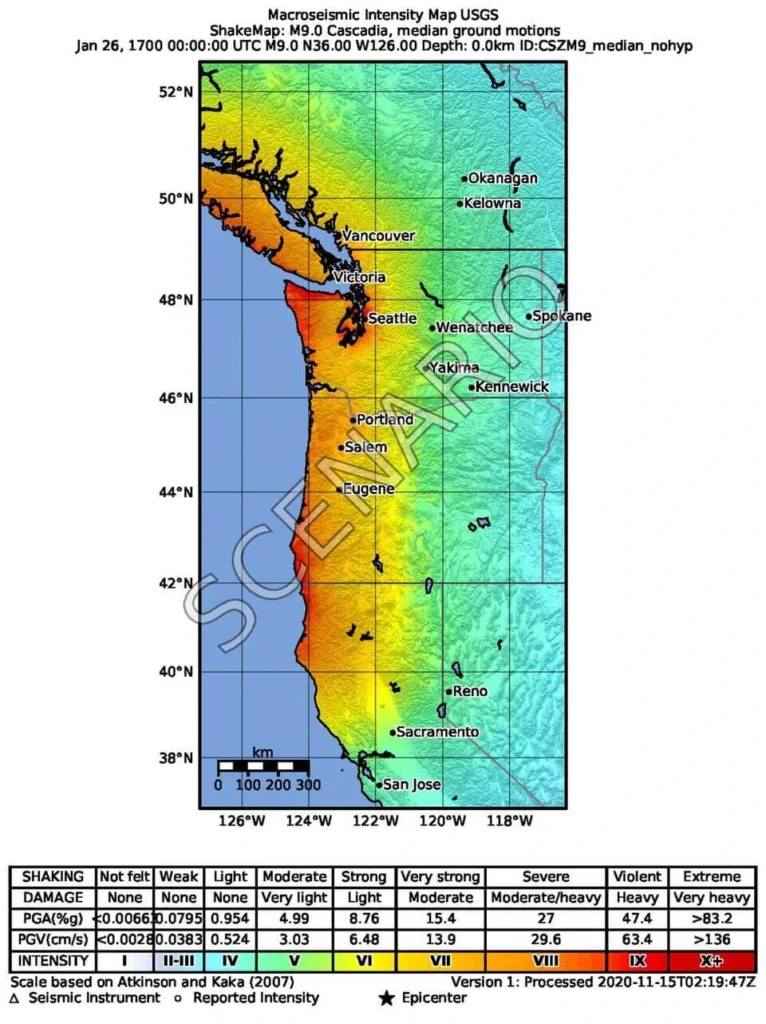
On the evening of 26 January 1700, about a thousand kilometres of the Cascadia megathrust ruptured in a magnitude 8.7–9.2 earthquake. The Pacific Northwest coast dropped one to two metres. Ten hours later, the tsunami flooded villages on the Honshu coast. No European wrote it down. The date was reconstructed three centuries later by piecing together buried marshes on the Washington coast, the killing year of red cedars and Sitka spruces drowned by saltwater, Japanese village records of an unfathered wave, and the oral histories of First Nations and Tribes from Vancouver Island to northern California.
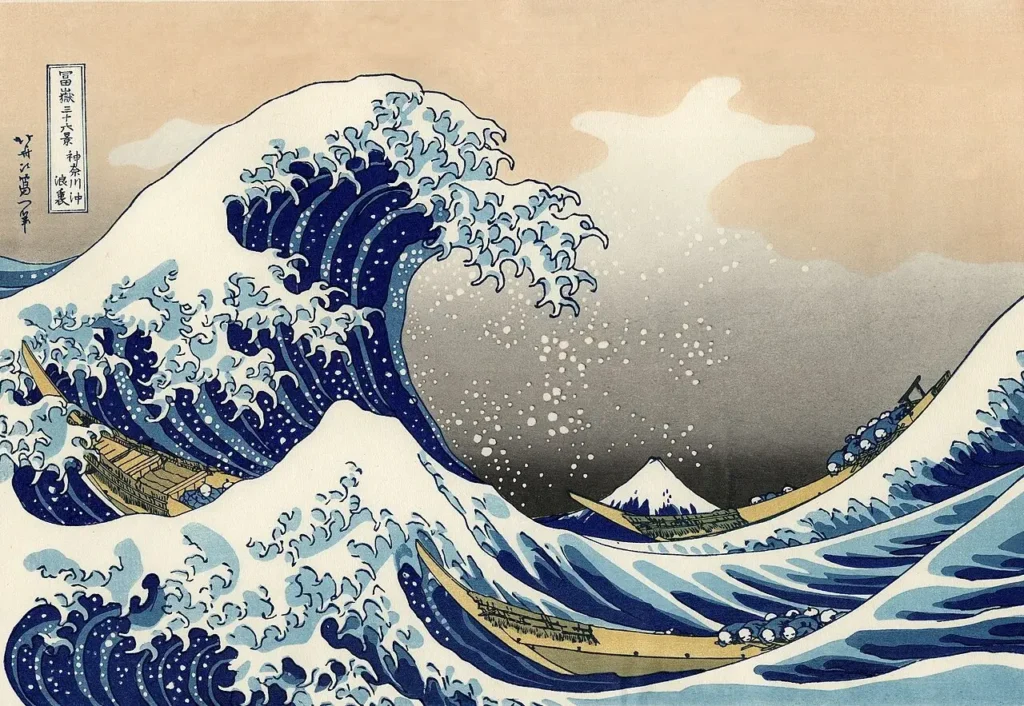
The Orphan Tsunami of 1700
It is the 8th day of the 12th month of Genroku 12. By the modern calendar it is 27 January 1700. Along the Pacific coast of Honshu, the sea begins behaving like a tsunami, but nobody has felt the ground shake. At Miho, on the Izu Peninsula, villagers watch the water rise and fall strangely enough for local officials to record it, though no damage is reported. Farther north, at Kuwagasaki, houses are carried off and a fire consumes others. At Ōtsuchi, salt kilns are damaged. Farther south near Tanabe, fields, crops and a storehouse flood, and the water reaches a castle moat. In place after place, officials write down the same fact: there had been no earthquake. In each place a literate official records the flooding because flooding has tax consequences, and in each place someone writes a version of the same sentence: there was no earthquake.
Those four words are what made the wave a puzzle. Japanese clerks in 1700 lived on a coast that had been pounded by tsunamis for as long as anyone could remember, and they had four centuries of records to compare against. A tsunami without a felt earthquake was not unheard of, but a tsunami without any felt earthquake reaching half of Honshu’s Pacific coast was an anomaly worth noting. The waves became known in Japanese historical seismology as the minashigo tsunami, the orphan tsunami: a wave with no parent (Atwater et al. 2015).
The parent was 7,500 kilometres away, on the far side of the Pacific, on a coast where in 1700 no European yet kept a written record. About ten hours earlier, just after nine in the evening on 26 January local time, the floor of the ocean off what is now Washington, Oregon, southern British Columbia and northern California had moved between five and twenty metres seaward, and a great deal of saltwater had moved with it.
The Cascadia Subduction Zone, in One Diagram
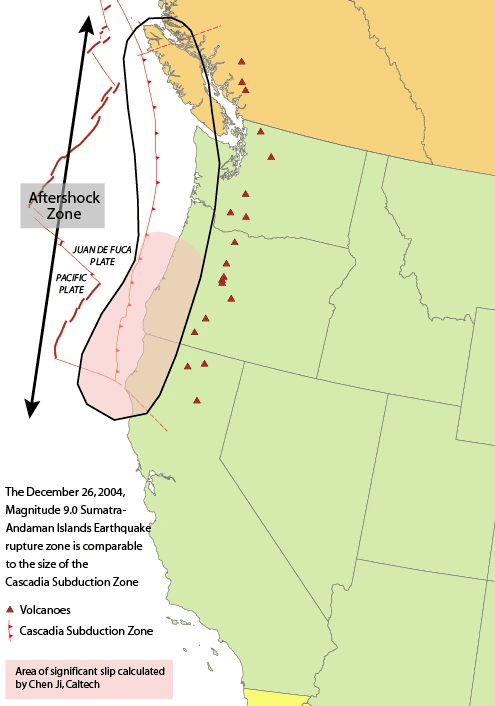
To understand why a Honshu salt kiln burned in 1700, start at a mid-ocean ridge off the coast of British Columbia and Washington called the Juan de Fuca Ridge. There, fresh basaltic ocean crust is being made and pushed eastward at roughly 28 mm per year, with a full spreading rate across the ridge of about 56 mm per year. By the time that crust reaches the North American margin roughly ten million years later, it is still hot and buoyant by oceanic standards, a young slab, geologically speaking, and the larger continental plate it meets is in the way. The plate boundary along which the oceanic crust dives down beneath North America is the Cascadia subduction zone. It runs about 1,000 to 1,100 kilometres from the Mendocino Triple Junction off northern California to the Nootka Fault off central Vancouver Island, and it consumes oceanic lithosphere at about 30–40 millimetres per year (Hyndman and Wang 1995; Wang et al. 2003).
That oceanic lithosphere is not a single plate. The largest piece is the Juan de Fuca plate proper, between the Blanco and Nootka transform faults. South of the Blanco it is called the Gorda plate; north of Nootka, the Explorer plate. All three are remnants of the much larger Farallon plate that has been disappearing under North America for tens of millions of years. The Cascade volcanic arc, Rainier, St. Helens, Hood, Shasta, Lassen, Garibaldi, stands above the slab where it reaches melting depths, a few hundred kilometres inland.
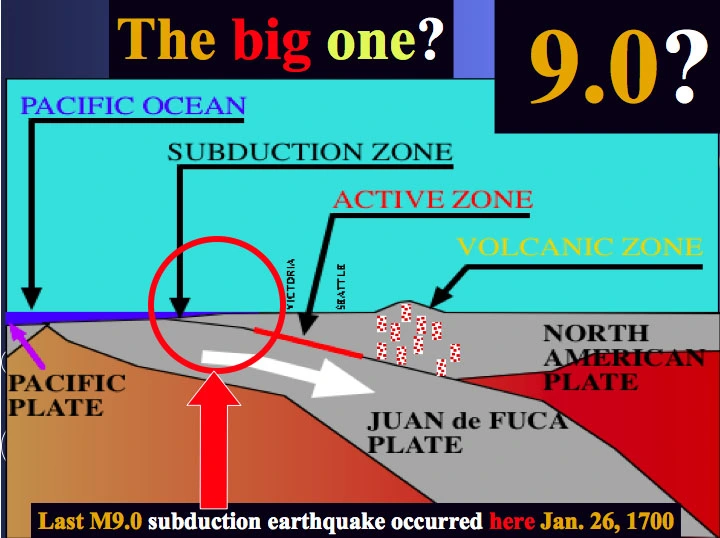
The boundary itself is a fault, called a megathrust when it is a long, shallow, subduction-related thrust capable of magnitude 8 or 9 earthquakes. Like all subduction megathrusts, it has a structure that can be sliced vertically into zones according to how it behaves between earthquakes. Updip, beneath the trench and the wedge of squashed sediment called the accretionary wedge, the rocks are cold, clay-rich and weak; they tend to creep aseismically. Below them is the locked zone, where the two plates are stuck together and accumulating elastic strain that will one day be released. Below that lies a transition zone, then a deeper interval where the plates again slide quietly, sometimes in slow, rhythmic pulses now known as episodic tremor and slip.
The locked zone, and why its position matters
The position and width of the Cascadia locked zone matter enormously, because they set the maximum size of the earthquakes the fault can host. In 1995, Roy Hyndman and Kelin Wang used heat-flow measurements, geodetic data, and a thermal model to map those zones along the entire Cascadia margin. They argued that the downdip edge of stick-slip behaviour roughly tracks the 350 °C isotherm, with a stable-sliding transition out to about 450 °C, and that the locked zone in Cascadia is largely offshore and updip of the coast (Hyndman and Wang 1995). Their model implied that great earthquakes there would rupture mostly under the seafloor: exactly the geometry needed to generate a damaging far-field tsunami.
By the mid-1980s, no one doubted that Cascadia was a subduction zone: that had been clear since the 1960s. The open question was whether the plate boundary was actually locked and accumulating strain, or whether it was creeping silently and disposing of the convergence in slow motion. The seismic record offered no help. In a century of instrumented observation, Cascadia had produced no plate-interface earthquakes at all. Two interpretations were possible. Either the fault was aseismic, in which case the cities and reactors of the Pacific Northwest had no megathrust problem, or it was very firmly stuck, with the next slip event still ahead. Tom Heaton and Stephen Hartzell, working from Pasadena, made the analogue argument in Science in 1987: Cascadia shares a young, buoyant downgoing slab and a slow convergence rate with southern Chile, southwest Japan and Colombia, places that have all produced magnitude 8 to 9.5 earthquakes in living memory. If Cascadia was storing strain, a sequence of great earthquakes, or a single giant, would be needed to fill the gap (Heaton and Hartzell 1987).
Argument by analogue could only do so much. The physical record had to be in the margin itself, in whatever the last earthquake had left behind. In the mid-1980s, Brian Atwater of the USGS started looking for it on the Washington coast.
Atwater at the Copalis River
The Copalis River at low tide, March 1986. The river is shallow, the marsh grass cold and brown, and the tide is pulling water seaward fast enough to expose a vertical face of soft brown peat and grey-blue mud against the channel. Brian Atwater has paddled in with a hand auger and a Japanese garden hoe called a nejiri gama. He scrapes a clean face and looks at it for a long time.
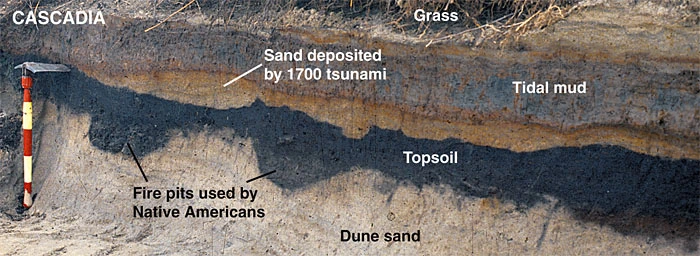
What he sees is a sandwich. At the bottom is grey tidal mud full of marine diatoms. On top of that mud is a sharp contact, then a 10–20 cm layer of peat with the rooted stems of marsh plants, three-square bulrush, tufted hairgrass, sea arrowgrass, preserved in growth position. On top of that peat is another sharp contact, sometimes overlain by a thin layer of clean fine sand, and then more grey tidal mud. The peat is a fossil marsh. It is the remains of a freshwater-to-brackish wetland that grew at roughly modern high-tide level and was then suddenly drowned: the ground dropped, salt water came in, the marsh died, and the dead marsh was buried fast enough that the leaves did not rot before the mud sealed them in (Atwater 1987).
The same stratigraphy appeared up and down the Washington and Oregon coasts: at the Niawiakum and Naselle near Willapa Bay, at the Salmon River in Oregon, at Netarts Bay, at Discovery Bay. Six buried soils in 7,000 years at some sites; the topmost buried soil consistently within the last few centuries. Atwater’s 1987 paper in Science argued that the only plausible mechanism for these synchronous, rapid drownings was tectonic subsidence: the kind that happens during a great subduction earthquake when the overriding plate, freed from the locked patch, suddenly rebounds seaward and downward. The thin sand bed atop several of the buried soils was almost certainly tsunami deposit (Atwater 1987).
How a Buried Marsh Records a Megathrust Earthquake
A marsh swamped gradually, whether by slow sea-level rise, an eroding spit, or sediment starvation, leaves a transitional top: brackish species moving in over decades, freshwater ones thinning out. Cascadia’s buried soils have knife-edge contacts instead, appearing synchronously across estuaries that share no plausible common cause. A tropical storm or a single river avulsion will not bury soils at the same moment on the Copalis, the Salmon and Discovery Bay. Sitting on top of each buried marsh, in many places, is a thin sand sheet with the grain-size sorting and the marine microfossils of a tsunami deposit, not the structureless mud of a slow infill.
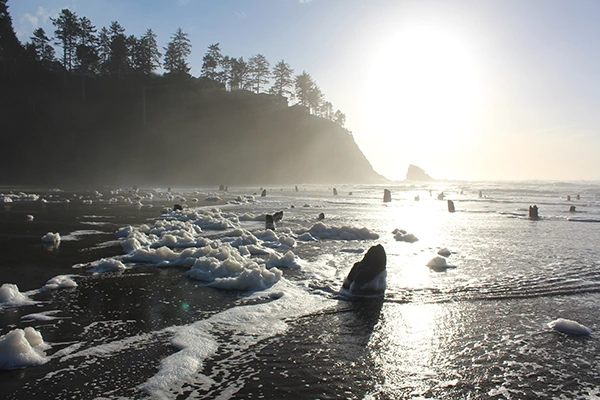
Atwater added a fourth line of evidence in the Copalis estuary itself: ghost forests. Western red cedar (Thuja plicata) and Sitka spruce (Picea sitchensis) tolerate damp soils but not salt. Where the coast dropped 1–2 metres in 1700, mature trees living above high tide found themselves suddenly within the daily tidal range. They were killed by saltwater intrusion to the roots and they died standing. Cedar is extraordinarily resistant to rot, so the trunks have stayed upright for three centuries, surrounded now by salt marsh. Many of the trees on the Copalis River still have bark. They are evidence of the rupture still standing in the soil where they died (Yamaguchi et al. 1997).
By the late 1980s the buried-soil and ghost-forest evidence had convinced most working geologists of the Pacific Northwest that Cascadia produced great earthquakes. The remaining controversy was about the size and timing of the most recent one. Radiocarbon dating of plant fragments in the topmost buried soil placed the most recent event in the late 17th or early 18th century, with site-by-site uncertainties of several decades. The window was wide enough to leave open two unsettling possibilities: a single magnitude-9 rupture along the entire margin, or a closely spaced sequence of smaller magnitude-8 ruptures over a decade or two. The hazard implications of those two scenarios are not the same. A single giant rupture moves a great deal of seafloor at once and produces a transpacific tsunami; a sequence of magnitude-8s mostly does not.
Settling the question required tighter dating: to a single year, ideally a single growing season. A thirty-year radiocarbon window could not do that. Tree rings could.
Tree-Ring Dating the 1700 Cascadia Earthquake
David Yamaguchi, a dendrochronologist at the University of Washington, took on the problem in the early 1990s. The principle of dendrochronology is simple: trees of the same species in the same climate produce annual rings that vary in width from year to year in a shared pattern. Match the pattern in an undated piece of wood to the pattern in a long, securely dated reference chronology, and you can read off the calendar year of every ring in the unknown sample. The technique is routine for archaeological timbers in the American Southwest and for medieval cathedrals in Europe, where the master chronologies are extremely long. For coastal Washington in the early 1990s, the master chronology had to be built from scratch.
The Cascadia red cedars solved a small but important problem on the way to a larger one. Red cedar is a slow-growing, long-lived species; some of the trees killed by the 1700 subsidence had been alive for several centuries before they died, with ring counts up to roughly 700–800 years. Yamaguchi and colleagues collected cross-sections from dead cedar and spruce snags around Willapa Bay, the Copalis River, Grays Harbor’s Johns River and the lower Columbia. They cross-dated those snags against ring chronologies from upland old-growth trees that were still living, building back from the present. They needed the outermost ring of each dead tree, the last ring the tree grew before it died.
The 1997 result, published as Scientific Correspondence in Nature, was tight enough to be definitive. Western red cedars from sites along the southern Washington coast, the Copalis River, Johns River and the Niawiakum estuary among them, had their outermost preserved ring in 1699. A parallel paper by Gordon Jacoby and colleagues, published in Geology the same year, examined trees that had survived the subsidence with disturbed growth, including Sitka spruces along the Columbia River, and arrived at the same dormant-season interval (Jacoby et al. 1997). The 1699 ring was complete: the tree had finished its full growing season, including the tight, dark latewood that forms in the autumn. There was no partial ring for 1700. The trees were not killed during the 1700 growing season. They were killed in dormancy, between the end of the 1699 growing season and the start of the 1700 one, that is, somewhere in the autumn-to-spring window of 1699–1700 (Yamaguchi et al. 1997). Satake’s date for the parent earthquake, evening of 26 January 1700, fell inside Yamaguchi’s dormant-season window for the dying trees (Satake et al. 1996).
The tree-ring evidence did one more thing. Because the dead snags were spread along at least 90 kilometres of Washington coast, all dying at the same dormant interval, the rupture had to be at least that long along strike. Coupled with Atwater’s similar buried soils as far south as the Salmon River in Oregon and as far north as Vancouver Island, the synchronous dying implied a margin-wide event. The tree-ring dating did one thing radiocarbon could not: it placed the killing within a single dormant season. That constraint strongly ties the Washington ghost forests to a single dormant-season event and made a single great rupture the simplest explanation. Later modelling has kept a sequence scenario alive in principle, but the Japanese tsunami records still require at least one very large Cascadia rupture on the evening of 26 January 1700: the two scenarios the buried-soil radiocarbon dates had been unable to separate (Yamaguchi et al. 1997, corrigendum). Combined with Atwater’s synchronously buried marshes from northern California to Vancouver Island, the single-season constraint is what supports the magnitude-9 upper estimate.
The Japanese Tsunami Records: Pinning the Date to a Single Night
While the North American work was running, an independent line of inquiry in Japan was approaching the same problem from its archives. Japan has kept usable records of damaging tsunamis since at least the 7th century. By the Edo period, when the Tokugawa shogunate ran the country from Edo and required district officials to file regular reports on weather, harvests, and disasters, the records become dense and durable. Most of them survive in temple archives, samurai diaries, village logbooks and the household account books of merchants who lost goods to flooding.
In the early 1990s, Kenji Satake, then at the Geological Survey of Japan, and colleagues set out to track down every Edo-period record of an unfathered tsunami: a wave that arrived without a felt earthquake. Most candidates dissolved on inspection into local storm surges or misdated reports of distant Japanese ruptures. One did not. From at least six sites along the Pacific coast of Honshu, Kuwagasaki, Tsugaruishi and Otsuchi in Iwate, Nakaminato in Ibaraki, Miho on the Izu peninsula, and Tanabe in Wakayama, independent records described a tsunami with run-up heights of roughly 1.5 to 5 metres, arriving in the small hours of Genroku 12, month 12, day 8 (Satake et al. 1996; Atwater et al. 2015).
Translated through the Japanese-Gregorian conversion, Genroku 12.12.8 falls on 27 January 1700 in the Western calendar. Working backwards from the arrival times at multiple Japanese sites, and using tsunami travel-time models calibrated against more recent events, Satake’s team placed the source on the far side of the Pacific. By eliminating each plausible alternative, South America, Kamchatka, Alaska, the Aleutians, all without contemporary earthquake records for that day, they arrived at Cascadia. The arrival times of the wave in Japan, given the great-circle travel path, implied a rupture at about 21:00 local time on 26 January 1700 Pacific time. The wave heights recorded in the Japanese accounts implied a moment magnitude near 9, with a rupture length on the order of 1,000 kilometres and average slip near 20 metres (Satake et al. 1996; Satake et al. 2003).
The two reconstructions had been built independently, in two languages and from separate archives an ocean apart, and they met on the same evening. Atwater’s mud was good to within a few decades. Yamaguchi’s tree-ring work cut that to a single dormant season, autumn 1699 through spring 1700. The Japanese ledgers were the third constraint, and they narrowed it to a span of hours.
Satake and Wang and Atwater followed up the 1996 paper with a more detailed reconstruction in 2003 in Journal of Geophysical Research, using the variation in wave height between the Japanese sites to constrain the slip distribution on the fault. Their preferred solution was an approximately 1,100-kilometre rupture with average slip of around 19 m, yielding a moment magnitude near 9 (Satake et al. 2003). A decade later, Pei-Ling Wang and colleagues took the inverse approach: instead of working backwards from the Japanese tsunami records, they worked forwards from new microfossil-derived estimates of how much the North American coast dropped in 1700 at dozens of sites between northern California and Vancouver Island. Their preferred model required heterogeneous slip, with high-moment patches separated by lower-slip segments, closer in character to what is now observed in instrumentally recorded great ruptures such as Tohoku 2011 and Maule 2010, and gave a magnitude between roughly 8.7 and 9.2 (Wang et al. 2013).
Coastal Memory
The Japanese records survived because they were written down, in a script and a language with a continuous archival tradition. On the North American coast the records also existed, they were spoken rather than written, and the difference would matter for three centuries.
Along the coast from northern California to the north tip of Vancouver Island, the peoples who lived through the night of 26 January 1700 did what people generally do after a catastrophe: they told stories about it: stories embedded in larger narratives about the order of the world and the actions of powerful beings often a great bird (Thunderbird) and a great whale, whose battles cause both shaking of the ground and great floods. Versions of this story exist among the Yurok and Tolowa in northern California, the Tillamook and Siletz in Oregon, the Quileute, Quinault, Hoh, Makah and Lummi in Washington, and the Huu-ay-aht (Ohiaht), Hesquiaht, Nuu-chah-nulth and Kwakwaka’wakw of Vancouver Island (Ludwin et al. 2005).
The most specific of these accounts comes from Pachena Bay, on the southwest coast of Vancouver Island. In 1964, the Huu-ay-aht elder Louis Clamhouse recorded for the ethnographer Eugene Arima the story of how the people of the Pachena Bay village were destroyed in one night. The land shook; the sea came up; the people who lived on the beach drowned where they slept; only those at higher villages or who happened to be elsewhere survived. Clamhouse placed the event in time by genealogical reckoning, counting back through his family to roughly the early 1700s. Ludwin and colleagues, weighting comparable estimates from oral traditions across the Cascadia coast, found a median date of 1701, within error of the date pinned by the Japanese and tree-ring evidence (Ludwin et al. 2005). The story knows nothing of tides or megathrusts. What it has is a winter night, violent shaking, the sea rising over the beach, a village gone by morning.
Ruth Ludwin, then a research seismologist at the University of Washington, led the team that systematically compared these oral histories with the paleoseismic record. The 2005 paper in Seismological Research Letters, co-authored across First Nations and Tribal communities, archaeology and geology, took the stories as data. It asked whether the event recorded in mud and tree rings was also discoverable in narratives coastal peoples had been carrying for ten generations.
The geological evidence reconstructs the event. The oral histories preserve what it was to live through it. The question that remains is how often the coast has lived through such a night, and how often it will again.
How Often Does a Great Cascadia Earthquake Happen?
To estimate how dangerous Cascadia is on a human timescale, you need many earthquakes, not one. The 1700 event is the most recent of a long series, and the long series lives mostly underwater.
The relevant archive sits offshore in the Cascadia Basin, in submarine canyons and channels that drain the continental slope into the abyssal plain. When the margin shakes hard enough, sediment perched on the upper slope fails simultaneously in many places. Those failures merge into turbidity currents, dense underwater avalanches of sand and mud that race downcanyon, depositing a graded bed called a turbidite: coarse at the base, fining upwards. A single great earthquake produces a turbidite simultaneously in many channel systems along strike; a storm or a single landslide does not. The Cascadia margin is unusually well suited to this kind of record because its submarine canyons feed into long, organised channel systems with low background sedimentation, so each turbidite stays distinct and readable.
Chris Goldfinger and colleagues at Oregon State University spent two decades cataloguing these beds in piston cores from Vancouver Island to Cape Mendocino. Their 2012 USGS Professional Paper 1661-F reported synchronous turbidites at multiple sites that match, within radiocarbon error, the time and number of buried-soil earthquakes onshore. Their record extends back through the Holocene to roughly 10,000 years ago, with the Mount Mazama ash that formed Crater Lake about 7,700 years ago serving as a stratigraphic marker partway down the section (Goldfinger et al. 2012).
Along the full margin, the catalogue records on the order of 19 full-length ruptures in the last roughly 10,000 years, plus another twenty or so partial ruptures that broke shorter, mostly southern segments. The mean recurrence interval for full-margin events is about 500 years; the range is roughly 200 to 1,000 years. The 1700 event was a full-margin rupture (Goldfinger et al. 2012). More recent work using abyssal turbidites in southern Cascadia and new tsunami-deposit chronologies on Vancouver Island (Tanigawa et al. 2022) is broadly consistent with the Goldfinger framework, though the precise count and segmentation of partial ruptures is still actively debated.
The next earthquake will probably look broadly like the 1700 one, magnitude 8.7 to 9.2, several minutes of strong shaking, one to two metres of coastal subsidence, transpacific tsunami, but with the possibility of being a smaller, segmented rupture that breaks only part of the margin. Because the recurrence distribution is wide, the time since 1700 (now 326 years) does not by itself imply that the next event is imminent or overdue. It implies that the conditional probability of a great rupture in the next 50 years is non-trivial, published estimates cluster around 10–14% for a full-margin M9 in the next 50 years, with the probability of any Cascadia rupture, including southern-segment-only events, closer to one in three (Goldfinger et al. 2012), and that this probability will keep rising.
What will the next Cascadia earthquake look like?
The 1700 earthquake is the cleanest blueprint anyone has for the next Cascadia rupture, but it is not the only one. The modern analogue case has gotten much stronger in the last two decades, because the world has been generous with great subduction earthquakes that can be measured rather than inferred.
The 27 February 2010 magnitude 8.8 Maule earthquake in southern Chile ruptured a Cascadia-like margin, with comparable convergence rate and slab age, and produced coastal subsidence on the same order. The 11 March 2011 magnitude 9.1 Tohoku-oki earthquake in Japan ruptured a longer locked zone with very high near-trench slip, drowned the Sanriku coast under tsunami waves up to about 40 metres locally, and killed about 15,900 people and left a further 2,500 missing. Tohoku surprised seismologists in two ways: the trench-breaking slip patch was larger than pre-event models predicted, and the rupture released so much energy that ground shaking in Sendai lasted for more than three minutes. Cascadia modelling now routinely incorporates Tohoku-like end-member scenarios with trench-breaking slip and long shaking durations (Wang et al. 2013).
The 28 March 2025 magnitude 7.7 Mandalay earthquake on the Sagaing fault in Myanmar (Mw 7.7 per USGS; Mw 7.8 in some seismological studies) offered a different kind of lesson. The Sagaing is a strike-slip fault, not a megathrust, so its mechanism is unlike Cascadia’s. The interesting feature was rupture speed. After an initial bilateral phase, the southward branch accelerated past the local shear-wave velocity to roughly 5 km/s and sustained that supershear speed over a segment of at least 200 km, with some kinematic models extending the supershear interval further south depending on how the segment boundary is defined (Wei et al. 2025; Goldberg et al. 2025). The total rupture broke about 475 km of the Sagaing, among the longest continental strike-slip ruptures on record, in the same range as the 1906 San Francisco and 1857 Fort Tejon events. The result was an unusually long and unusually fast tear for a magnitude 7.7, with violent near-fault shaking over hundreds of kilometres and modern-analog comparisons drawn to the 1906 San Francisco earthquake (Goldberg et al. 2025; Vera et al. 2025).
The Cascadia margin is not expected to host a supershear strike-slip rupture in the same way: the megathrust geometry is wrong for it. But the Mandalay earthquake does drive home a broader point: that the empirical scaling relations used to forecast ground motions are based on a small sample of large events, and that the next great earthquake anywhere can still produce surprises that the previous one did not foreshadow. A Cascadia rupture in 2030 or 2080 will not be a carbon copy of 1700.
How are Pacific Northwest communities preparing for the next Cascadia earthquake?
Between Cape Mendocino and the northern tip of Vancouver Island live roughly nine to ten million people. The cities of Vancouver, Victoria, Seattle, Tacoma, Olympia, Portland, Eugene and Eureka all sit within the strong-shaking footprint of a margin-wide Cascadia rupture. The outer coast, beaches and small towns from Tofino to Ocean Shores to Cannon Beach to Crescent City, sits inside the modelled tsunami inundation zone for a Cascadia source, with arrival times to the closest beaches of roughly 15 to 30 minutes after rupture initiation. A 2030 or 2050 repeat of 1700 would be the largest natural disaster in the recorded history of either Canada or the contiguous United States.
Since the mid-2010s, public understanding has caught up with the science, and the region has moved from awareness to preparation. Washington and Oregon now require new critical structures, schools, hospitals, bridges, to be designed against Cascadia ground motions that explicitly include long-duration, low-frequency shaking. Older unreinforced masonry buildings in Seattle and Portland remain a serious life-safety problem, but retrofit programs exist and are running.
Coastal communities have adopted tsunami inundation maps with legal force. Evacuation routes are signed and walked. In Westport, Washington, and at the Ocosta School District, purpose-built vertical evacuation structures stand within fifteen minutes’ walk of the surf, designed to give people who cannot reach high ground something to climb instead.
ShakeAlert, operated by the U.S. Geological Survey with partners at Caltech, UC Berkeley, the University of Washington, the University of Oregon and Central Washington University, has been delivering public earthquake early warnings in California since 2019, Oregon since March 2021, and Washington since May 2021. Version 3 of the software went live in 2024 and added geodetic inputs, high-rate GPS, that allow the system to track magnitude growth in real time during the first minute of a great rupture. That is the kind of capability that the 2011 Tohoku-oki experience showed to be essential; without it, the alert system tends to underestimate magnitude 8 and 9 events from their first seconds (McGuire et al. 2025). The build-out of the seismic and geodetic station network in the Pacific Northwest is in its final phase, with full coverage on track in the coming years (McGuire et al. 2025). The alert system does not prevent earthquakes; it gives, depending on distance from the rupture, seconds to a couple of minutes of warning before strong shaking arrives.
Indigenous communities have been preparing in their own way. The Huu-ay-aht First Nation, whose ancestors lived in the Pachena Bay village destroyed in 1700, built a new administration building on high ground above the bay so that residents have somewhere to evacuate vertically; the village of Anacla remains in the lower elevations, but plans exist to move it. The Quileute Tribe in La Push, Washington, has moved its school and tribal centre uphill in a federally backed relocation. The Makah at Neah Bay have done similar planning. These moves apply a 326-year-old story to a problem that is geologically certain to recur, although neither science nor oral tradition can tell us in which decade.
Cascadia is not going to rupture today. It will rupture, and the clock on when started 326 years ago.
Marsh mud on the Copalis, cedar snags on Johns River, court ledgers in Edo: three centuries on, all three reconstruct the same evening to within hours of when it happened. So does the story Louis Clamhouse told Eugene Arima in 1964, in a language none of the geologists involved could read.
Frequently Asked Questions
Why is the 1700 tsunami called “orphan”? Japanese coastal records from the 1700 event describe a damaging tsunami arriving without any felt earthquake in Japan. In Japanese historical seismology, a tsunami whose parent earthquake is unknown is called minashigo tsunami or “orphan tsunami.” The 1700 event was orphaned for nearly three centuries until Satake and colleagues identified the Cascadia subduction zone as its source in 1996.
How does the Cascadia subduction zone differ from the San Andreas fault? They are entirely different kinds of faults. The San Andreas is a transform boundary where the Pacific and North American plates slide past each other horizontally; it produces magnitude-7 to mid-7 earthquakes such as the 1906 San Francisco rupture. The Cascadia subduction zone is a thrust boundary where the Juan de Fuca plate dives beneath North America; it can produce magnitude 8 to 9 earthquakes and transpacific tsunamis. The two systems meet at the Mendocino Triple Junction off northern California.
What is episodic tremor and slip? Below the seismogenic locked zone of the Cascadia megathrust, the plate boundary slips quietly in rhythmic pulses lasting days to weeks, accompanied by faint seismic tremor. These events have been recorded by GPS and seismometer networks since the early 2000s and recur at roughly 14-month intervals beneath Vancouver Island. They release accumulated strain without producing strong shaking and are not earthquakes in the conventional sense.
Could a Cascadia earthquake affect inland cities like Seattle and Portland? Yes. A full-margin Cascadia rupture would produce strong, long-duration shaking, several minutes of it, across the entire Cascadia forearc, including Seattle, Tacoma, Olympia, Portland, Eugene, Victoria and Vancouver. Inland cities are outside the tsunami inundation zone but are exposed to the same ground motion as the coast, with the added hazard of basin amplification in the Seattle and Portland metropolitan areas.
