


The Northern Appalachian Anomaly, Explained
In brief: The Northern Appalachian Anomaly is a 350-to-400-kilometre-wide patch of unusually hot mantle rock about 200 km beneath New England. A 2025 paper in Geology by Thomas Gernon and colleagues argues that it formed roughly 80 million years ago during the opening of the Labrador Sea between Greenland and Canada, then drifted some 1,800 km southwest at 20 km per million years to its present position. The same mechanism, a propagating chain of lithospheric drips called a mantle wave, helps explain why the 290-million-year-old Appalachian Mountains are still high. Whether the same mechanism also accounts for deep heat warming the base of the Greenland Ice Sheet is contested.
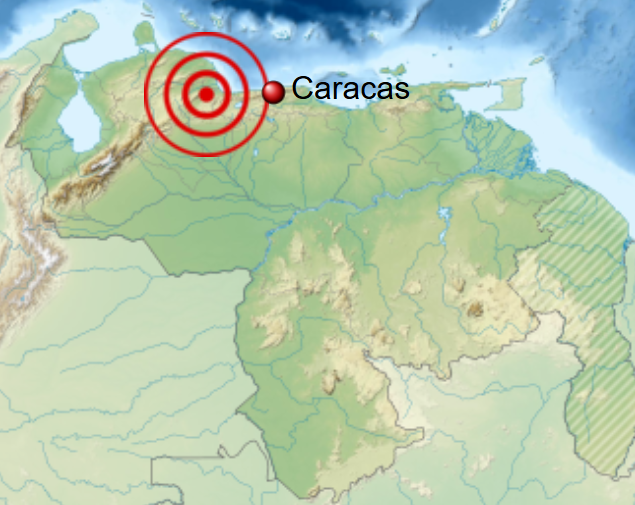
A patch of unusually hot rock the size of Maine is drifting southwest through the upper mantle beneath New England, about 200 kilometres down, on a slow trajectory toward New York City. Seismic waves passing through it run roughly 10 percent slower than they should, which means temperatures inferred from those waves, well above 1,500 °C at 100 km depth, match what you would expect under an active rift zone, not under a 290-million-year-old passive margin. The feature has two names: the Northern Appalachian Anomaly to geologists, the “hot blob” to headline writers. It is about 350 to 400 kilometres across, sits at roughly 200 km depth, and it is moving.
The eastern margin of North America has been a passive margin for around 180 million years, which makes that motion difficult to explain. The Appalachian orogeny ended its last great pulse, the Alleghanian collision between Laurentia and Gondwana, between roughly 325 and 260 million years ago. Yet a continent-scale thermal upwelling is migrating southwest under that margin at about 20 kilometres per million years. A 2025 paper in Geology by Thomas Gernon and colleagues at the University of Southampton, the Helmholtz Centre for Geosciences in Potsdam, and the University of Florence traces this anomaly to a different breakup altogether: the opening of the Labrador Sea about 80 million years ago, when Greenland separated from North America.
How Seismic Tomography Mapped the Northern Appalachian Anomaly
The anomaly was first hinted at in 1997, when Suzan van der Lee and Guust Nolet built a continent-scale Rayleigh-wave tomographic model of North America and noticed an unusually slow patch in the upper mantle beneath New England. Over the following two decades, denser instrument coverage, particularly the rolling deployment of the EarthScope USArray transportable array between 2013 and 2015, turned that smudge into a sharply imaged feature. Schmandt and Lin’s 2014 P- and S-wave tomography in Geophysical Research Letters, and subsequent work by William Menke, Vadim Levin, Fiona Darbyshire and colleagues, converged on similar dimensions: a roughly 400-km-wide low-velocity region centred near 200 km depth beneath southern New England.
Menke and co-authors, writing in Geophysical Research Letters in 2016, concluded that the maximum shear-velocity contrast reaches about 10 percent at 200 km depth, with a compressional-to-shear perturbation ratio near unity. More recent regional and global tomographic models, including those cited by Gernon’s group, image the same anomaly at a more muted 1–4 percent shear-velocity reduction; the higher Menke figure comes from a denser local body-wave inversion. These ratios point to a thermal rather than compositional anomaly. Chemical heterogeneities tend to perturb P and S velocities by different fractions; Menke’s team observed roughly equal P and S perturbations: the thermal signature. They concluded the NAA represents a modern asthenospheric upwelling, hotter than its surroundings by at least ~100 °C.
Subsequent studies refined the temperature picture. Receiver-function analysis from the New England Seismic Transects (NEST) array, published by Espinal, Long and colleagues in Geophysical Research Letters in 2024, identified a strong negative-velocity gradient between roughly 60 and 110 km depth above the NAA. The lithosphere directly over the anomaly has been thinned. A magnetotelluric study published in Geochemistry, Geophysics, Geosystems in 2025 by Kim and colleagues showed that low-resistivity zones along the northern and western edges of the NAA cannot be explained by heat alone and likely require volatiles, possibly small amounts of partial melt. Mazza and colleagues (2014) modeled primary magma temperatures of ~1,410 °C ± 25 °C at ~2.3 GPa (roughly 75 km depth) for the Eocene basalts above the Central Appalachian Anomaly: conditions slightly hotter than the present mantle beneath mid-ocean ridges. For the NAA itself. Dong and Menke (2017) used seismic attenuation to infer mantle temperatures of ~1,550–1,650 °C at ~100 km depth, hotter still. The Gernon group’s 2025 estimate of a ~100–150 °C thermal contrast at 200 km depth is consistent with these shallower constraints.
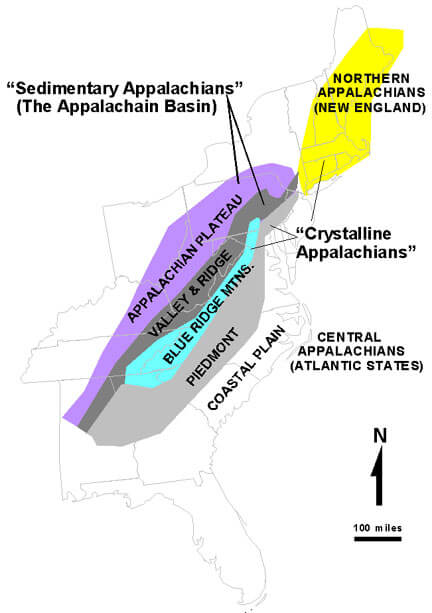
The NAA, the Central Appalachian Anomaly, and the Greenland Twin
Tomographic models published in Tectonophysics in 2021, and again in Journal of Geophysical Research: Solid Earth in 2025 by Luo, Long and colleagues, image a chain of low-velocity features along the eastern North American margin. To the south of the NAA, beneath Virginia and West Virginia, lies the Central Appalachian Anomaly, where Eocene basaltic dikes about 48 million years old yield primary magma temperatures of around 1,400 °C at depths near 80 km. Further south still, a weaker Southern Coastal Anomaly stretches from Georgia to Virginia. Across the Atlantic, beneath north-central Greenland, a comparable warm zone heats the base of the kilometres-thick ice sheet.
Gernon, Brune, Hincks and Keir argue in their Geology paper that the Greenland heat zone and the NAA are mirror images: twin instabilities born on opposite flanks of the Labrador Sea as it opened in the Late Cretaceous.
Why Earlier Explanations of the Northern Appalachian Anomaly Fell Short
The three earlier candidates
For decades, three competing ideas held the field. The first invoked the Central Atlantic Magmatic Province, the flood-basalt event that erupted around 201 million years ago at the end of the Triassic, and the subsequent rifting that initiated Atlantic seafloor spreading around 175 to 180 million years ago. Heat from that long-extinct event, the argument went, could have lingered in a slow-cooling lithospheric scar. A related idea attributed both the NAA and the Great Meteor Hotspot’s putative track to mantle-plume material that traversed New England roughly 130 to 100 million years ago, leaving behind the Monteregian Hills intrusions and the New England Seamount chain. The third invoked edge-driven convection: the steep step in lithospheric thickness between the cold cratonic interior and the thinner, warmer margin should drive small-scale convection cells, with downwelling beneath the craton’s edge and upwelling roughly 500 to 1,000 km offshore.
The Pangaea-rift inheritance hypothesis stumbled on the simplest physical objection. Upper-mantle thermal anomalies equilibrate over tens of millions of years. A scar from the Jurassic opening of the Atlantic, nearly 200 million years old, should have largely cooled away by now. The hotspot-track hypothesis ran into geometry problems. As Menke and colleagues pointed out in 2016, the NAA does not elongate along the predicted Great Meteor track, and the spatial overlap looks coincidental rather than causal.
Why a leftover from Pangaea no longer adds up
Edge-driven convection survived longer as the favoured explanation, and it remains a reasonable description of present-day flow patterns. Cooper Boemmels and colleagues, Mustelier and Menke, and Long and others have all marshalled receiver-function and SKS-splitting data consistent with small-scale upwellings near the craton margin. The Lopes 2020 SKS analysis from the SEISConn array showed that splitting delay times decrease toward the eastern edge of the array, which is what one would expect if vertical mantle flow disrupts the otherwise horizontally aligned olivine fabric of the asthenosphere.
Edge-driven convection has had trouble explaining the NAA’s precise location. The anomaly sits in a westward indentation of the cratonic margin, several hundred kilometres inboard of where the simplest edge-cell models predict the upwelling limb. The Central Appalachian Anomaly poses the same geometric problem. By the early 2020s the NAA was a sharply imaged feature whose origin remained open.
Reframing the NAA’s Origin Through Mantle Wave Theory
How rifting triggers a chain of lithospheric drips
The Gernon group’s reframing grew out of a different problem altogether: where diamonds come from. In a 2023 Nature paper (DOI 10.1038/s41586-023-06193-3), Gernon, Stephen Jones, Brune, Hincks, Keir and an international team showed that kimberlite eruptions, which deliver diamonds from depths greater than 150 km, peak roughly 30 million years after continental breakup and migrate inland from the rift edge at a median rate of about 26 km per million years. They proposed a mechanism. As continents stretch, hot asthenosphere flows up to fill the widening gap. The contact between this new hot material and the cold continental keel generates steep temperature and density gradients across the thermal boundary layer at the base of the lithosphere. Rayleigh-Taylor instabilities form there. Dense, viscous lithospheric drips peel away in series, each new drip forming slightly farther inland than the last.
The team called this propagating chain a “mantle wave.” A 2024 paper in Nature by the same group extended the idea to continental escarpments and inland plateaus, showing that the mantle wave drives kilometre-scale uplift hundreds of kilometres inland of a rift over tens of millions of years. Science magazine named the mantle-wave framework a finalist for its 2024 Breakthrough of the Year. The 2025 Geology paper applied it to a single specific question: could the chain of low-velocity anomalies along eastern North America be the slow signature of a mantle wave radiating inland from the Labrador Sea?
Tracing the wave from the Labrador Sea to New Hampshire
The Labrador Sea opened in stages. Crustal stretching between Greenland and the Labrador margin began in the Early Cretaceous, accelerated through the Late Cretaceous, and produced its first unambiguous seafloor-spreading magnetic anomalies near Chron 27 in the early Paleocene. The Gernon paper places rift onset around 120 million years ago in the Early Cretaceous, with some reconstructions pushing initiation back further; final breakup occurred between roughly 90 and 80 million years ago, culminating around 82 Ma. Working back from the NAA’s present position at a 20 km/Myr migration rate, the authors infer that the first Rayleigh-Taylor drips formed along the rift’s inner edge roughly 94 to 91 million years ago, after rifting had begun but several million years before final continental separation.
The team’s Geology paper combines geologic observations, plate-tectonic reconstructions, and thermo-mechanical simulations. The simulations track the evolution of a synthetic rifted margin and produce convective drips that migrate inland at about 20 km per million years. That migration rate, multiplied by roughly 80 million years, places the leading drip about 1,600 to 1,800 km from where it began. That figure, the authors point out, is close to the geospatial offset between the Labrador Sea margin and the present centre of the NAA beneath New Hampshire and Vermont.
The Central Appalachian Anomaly, in their reading, is an earlier drip from the same wave. The 48-million-year-old Eocene basalts above it record an episode of thinning that reached Virginia before the leading drip reached New England. The Southern Coastal Anomaly may be a still-earlier and more spread-out remnant. Together, the three anomalies record a sequence of dripping episodes spaced a few tens of millions of years apart.
“As the continent stretches and begins to split, space opens up beneath the rift. That space is rapidly filled by an inflow of soft, flowing asthenosphere. This sudden movement disturbs the edge of the continent’s root, triggering a chain reaction. Much like falling dominoes, blobs of the root begin to drip downward one after another. These ‘drips’ migrate inland over time, away from the rift. We think this same process might explain unusual seismic patterns beneath the Appalachians. The timing lines up perfectly.”, Thomas Gernon, University of Southampton
The Greenland twin
Greenland has its own well-known thermal mystery. Ice-penetrating radar and ice-core data show widespread basal melting in the north-central part of the ice sheet, particularly near the head of the roughly 600-km-long Northeast Greenland Ice Stream. In 2016, Irina Rogozhina, Alexey Petrunin and colleagues, writing in Nature Geoscience, mapped a geothermal anomaly spanning roughly a quarter of Greenland’s land area and attributed it to the passage of the island over the Iceland mantle plume between roughly 80 and 35 million years ago.
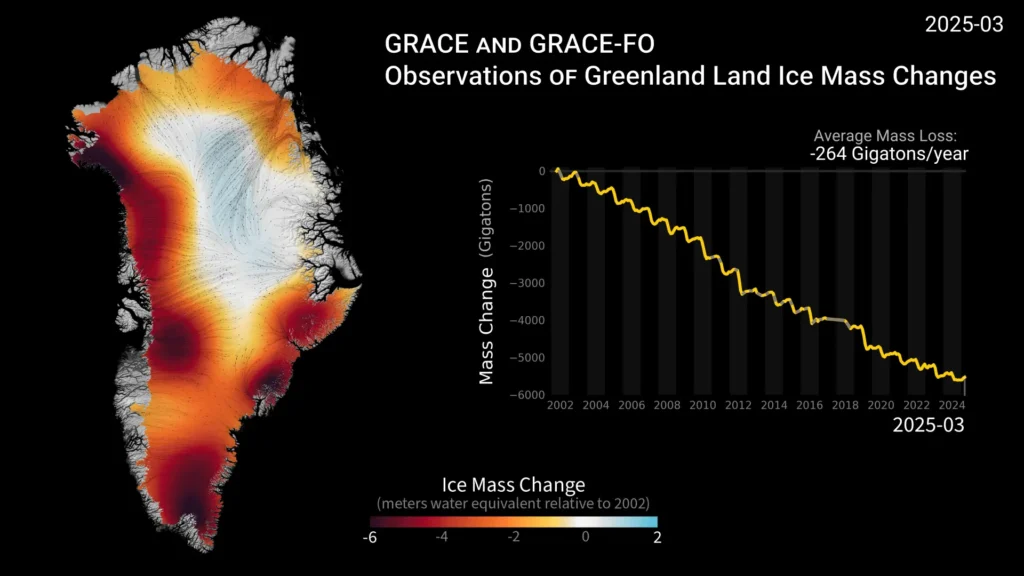
The Gernon paper does not dispute the Iceland-plume track entirely, but it points out that the north-central Greenland heat zone sits in geometry consistent with a mantle-wave drip on the opposite flank of the same Labrador Sea rift that produced the NAA. If both anomalies share an origin, they would be a matched pair born on either side of a continent as it tore in two. Either way, the consequence for the ice sheet is the same: heat reaching the ice base raises basal temperatures toward the pressure-melting point, producing meltwater that lubricates ice-stream flow. Recent joint-inversion work by Ajourlou and colleagues at the University of Ottawa, published in PNAS in late 2025 (122(50), DOI 10.1073/pnas.2504752122), has refined regional upper-mantle temperature models beneath the Greenland Ice Sheet. Their results favour the Iceland-hotspot reconstruction rather than a Labrador-rift origin for the Greenland thermal pattern, but they reinforce the broader point that deep mantle structure modulates modern ice-flow dynamics, whichever mechanism is responsible.
Ice-sheet models of Greenland’s response to climate warming are sensitive to assumptions about basal heat flow. If a meaningful share of that heat comes from an 80-million-year-old rifting event, sea-level projections from Greenland melt depend on geological history that ice modellers rarely incorporate.
Why the Appalachian Mountains Are Still High After 290 Million Years
What dynamic topography means
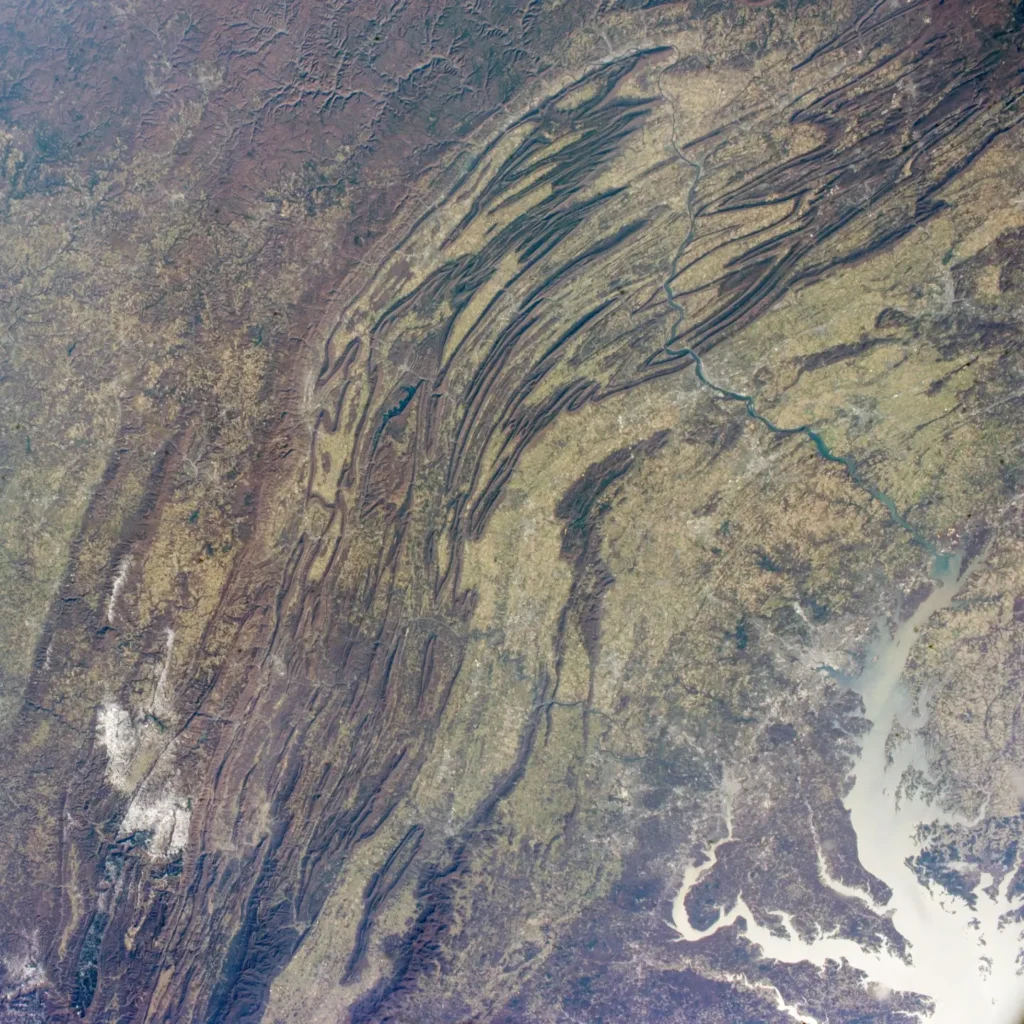
The Appalachians should be a low plain. The Alleghanian orogeny ended in the Permian, and more than 250 million years of erosion ought to have flattened a Permian Andes. Yet Mount Mitchell in North Carolina rises to 2,037 metres, Mount Washington in New Hampshire to 1,917 metres, and the Blue Ridge escarpment drops more than a kilometre in places. Cosmogenic-nuclide erosion rates on Appalachian summits run only a few metres per million years: slow, but slow alone is not enough to keep peaks this high above sea level. Something is supporting them from below.
Geophysicists use the term dynamic topography for the component of Earth’s surface elevation that crustal thickness alone cannot explain, the lift or sag that mantle flow imposes on the lithosphere from below. A hot, low-density upwelling can raise the overlying surface by several hundred metres; a cold downwelling drags it down. Southern Africa’s high interior plateau, lifted by an anomalously hot deep-mantle upwelling, is the textbook example. Eastern North America has long been suspected of carrying a similar component on the order of a few hundred metres, particularly across the central and northern Appalachians.
The mantle-wave hypothesis offers a natural source for that lift. A patch of hot, buoyant asthenosphere 200 km beneath New England would push the overlying lithosphere upward. The same process repeated farther south, beneath the Central Appalachian Anomaly, would have done the same. As the wave migrates southwest at 20 km per million years, so does its dynamic-topography signal. The Appalachians ride on a slowly travelling welt rather than a single uplifted block, with the highest dynamic contribution moving along behind the leading drip.
Lithospheric delamination and buoyant rebound
A second mechanism operates at the lithosphere itself. Each Rayleigh-Taylor drip removes a piece of dense, cold lithospheric mantle from the base of the plate. The plate’s average density drops, and it floats higher on the underlying asthenosphere, isostatic rebound, in the same sense that a ship rises after dropping cargo. Gernon’s group estimates that drips during the Cretaceous Pangaea breakup and the later Labrador rift could have stripped tens of kilometres of mantle root from beneath parts of the Appalachian belt, contributing a kilometre or so of long-wavelength uplift over tens of millions of years.
Receiver-function imaging from the NEST array supports this. The Espinal team’s 2024 results place the lithosphere-asthenosphere boundary at 60 to 110 km depth above the NAA, far shallower than the 200+ km lithosphere typical of cratonic interiors. The plate has been thinned from below, and the buoyancy of the hot asthenosphere now occupying the missing volume helps explain why the Appalachians, more than a quarter-billion years after their last orogenic pulse, still support Krummholz forest above 1,400 metres.
The same long history that wore the Permian peaks down also produced features like the Great Unconformity in Appalachian basement exposures, where hundreds of millions of years of rock are simply gone. The mantle wave provides a slow, deep counterweight to that surface destruction, lifting the range a little while time and water work it down.
Where the Northern Appalachian Anomaly Is Moving Next
The trajectory toward New York
At that pace, the centre of the Northern Appalachian Anomaly will pass roughly beneath the New York City metropolitan area in about 15 million years, according to the Gernon team’s calculations. The Manhattan schists beneath the city are already nearly half a billion years old and deeply eroded.
The anomaly is travelling southwest, broadly aligned with the regional pattern of asthenospheric flow inferred from continental-scale shear-wave splitting and from global mantle-flow models. That flow direction, in turn, follows the absolute motion of the North American plate. Whether the NAA is being carried passively in the mantle “river” or is propagating as part of a coherent wave of dripping instabilities is exactly the question Gernon’s simulations were designed to address. The simulations favour the second interpretation, but the two effects probably combine.
What the NAA does not imply
The NAA carries no implication for surface hazard. The melt fraction inferred from magnetotelluric data is small, the depth is roughly 200 km, and at that depth buoyant ascent of any partial melt would take millions of years even under favourable assumptions. A magma chamber working its way toward the surface looks nothing like this. New England’s seismicity comes from old faults reactivating under post-glacial rebound and far-field plate forces, and the Gernon paper makes no claim otherwise.
Volcanism is similarly unlikely on any geological timescale relevant to human concerns. The last meaningful igneous activity along the eastern margin produced the Cretaceous Monteregian intrusions in Quebec (~125 Ma) and the Eocene basalt dikes of Virginia and West Virginia (~48 Ma). The eastern United States is not on a path to become volcanically active again, and the surface processes that will dominate over the next few million years, slow uplift in some places, slow tilting in others, are far gentler than what cosmogenic erosion measures already record.
The stakes are elsewhere. Long-term landscape evolution along the Atlantic margin, the Cenozoic sediment record on the continental shelf, and basal heat flow under the Greenland Ice Sheet all depend partly on what the upper mantle is doing 200 km below the surface: a factor sea-level projections and source-to-sink models rarely incorporate. The seismic and heat-flow deployments now in the field will refine that picture on a part of the mantle that mid-twentieth-century textbooks treated as inert.
Open questions
Several uncertainties remain large. The 2025 paper rests on geodynamic simulations and plate reconstructions, not on direct dating of the drips themselves. The mineralogical and geochemical fingerprint that would distinguish a Labrador-Sea-origin drip from an Africa-rift remnant has not yet been recovered from any deep xenolith in the relevant part of the Appalachians. The exact age of Labrador Sea breakup remains debated. The Gernon paper places it at 90 to 80 million years ago, culminating around 82 Ma, but earlier estimates that anchor breakup to later magnetic chrons extend the range as young as 60 Ma. The Gernon team’s 80-million-year value sits within the more recent consensus window, but it is not pinned by independent dating of the mantle anomalies themselves.
Several seismic deployments are now in the field to address these gaps. The GENESIS array, deployed across New England since 2022, complements the earlier SEISConn and NEST experiments and is producing higher-resolution images of the lithosphere-asthenosphere boundary above the NAA. Magnetotelluric inversions of the long-period EarthScope dataset will continue to refine estimates of volatile content and melt fraction. Heat-flow boreholes in the northeastern United States, though sparse, will help test whether the surface heat signal carries any detectable component from the 200-km-deep anomaly.
Wherever continents have separated cleanly and recently, South America from Africa across the South Atlantic, India from Madagascar, Australia from Antarctica, the mantle-wave model predicts inland trails of similar instabilities. Some of those trails should already be partly imaged in regional tomography. If the predictions hold up, the eastern North American case will turn out to be one example of a fairly general phenomenon, and continents will look a great deal less stable beneath their feet than they look from the surface.
The question of where the wave’s heat is sourced, from the asthenosphere alone, or in part from the large low-shear-velocity provinces near the core-mantle boundary that anchor the slowest deep-mantle currents, is well beyond what a single 2025 paper can settle. The relationship between mantle convection and the more familiar processes of the core, including Earth’s magnetic field reversals, also operates on timescales that overlap with the mantle wave but are governed by different physics.
Gernon and colleagues have proposed that the eastern United States, often treated as tectonically inert, preserves a slow record of its own rifting history in thermal patterns 200 km below the surface. Whether the mantle-wave model holds will depend on what the next decade of seismic and magnetotelluric data shows, and on whether xenoliths recovered from the relevant part of the Appalachian belt carry a geochemical fingerprint consistent with Labrador-Sea origin.
Frequently Asked Questions
Is the Northern Appalachian Anomaly dangerous?
No. The NAA sits at about 200 km depth, far below the brittle crust where earthquakes form. The 2025 Geology paper does not link it to earthquake hazard, and New England’s modest seismicity is governed by old faults reactivating under slow stresses, post-glacial rebound, far-field plate forces, not by deep thermal anomalies. There is no melt rising toward the surface and no plausible path to volcanism on any human timescale.
Will the Appalachians ever become volcanic again?
Not within tens of millions of years. The youngest serious igneous activity along the eastern margin produced the Cretaceous Monteregian intrusions in Quebec (~125 Ma) and the Eocene basaltic dikes of Virginia and West Virginia (~48 Ma). Nothing in the present data suggests a return. The NAA is hot but its melt fraction is small and it sits too deep to feed surface eruptions efficiently.
Why are the Appalachians so old yet still high?
The Appalachians stay high because slow erosion in the humid eastern US, typically only a few metres per million years on resistant ridges, is partly offset by deep-mantle buoyancy. Lithospheric drips have thinned the plate beneath parts of the range, leaving hot, low-density asthenosphere at shallower depth than usual. That buoyancy, called dynamic topography, lifts the overlying surface by hundreds of metres. A mountain belt that finished assembling 290 million years ago is being lowered by erosion and lifted by deep-mantle buoyancy at roughly the same rate, which is why it persists.
What is a mantle wave?
A mantle wave is a propagating chain of Rayleigh-Taylor instabilities along the base of the lithosphere, proposed by Gernon and colleagues in a 2023 Nature paper to explain why kimberlite eruptions peak roughly 30 million years after continental breakup and migrate inland at ~26 km/Myr. When a continent rifts, hot asthenosphere rises into the gap and contacts the cold continental keel along a steep thermal and density gradient. Dense lithospheric material peels away in successive drips that migrate inland at roughly 20 km per million years. Despite the name, nothing physically waves. The sequential drips leave a trail of thermal anomalies behind them as each one peels away farther inland than the last.
How was the NAA discovered?
The first hint came from a 1997 Rayleigh-wave tomographic model by Suzan van der Lee and Guust Nolet. Denser seismic networks through the 2000s and 2010s, especially the EarthScope USArray transportable array, deployed across the eastern United States between 2013 and 2015, sharpened the image. Menke, Skryzalin, Levin, Darbyshire and colleagues quantified the NAA’s dimensions in 2016 from P- and S-wave travel times. More recent NEST and GENESIS deployments are adding receiver-function detail on the lithosphere-asthenosphere boundary directly above the anomaly.
Is the same thing happening anywhere else on Earth?
The mantle-wave framework predicts inland trails of dripping instabilities behind every clean continental breakup. Candidate signatures have been identified beneath the South American and South African plateaus inherited from the Gondwana rift, beneath the Western Ghats of India, and along the rifted Australian margin. The clearest mirror case is the geothermal anomaly beneath north-central Greenland, born on the opposite flank of the same Labrador Sea rift that produced the NAA, roughly 80 million years ago.