The Indian Ocean “Gravity Hole”: How Earth’s Largest Geoid Low Formed
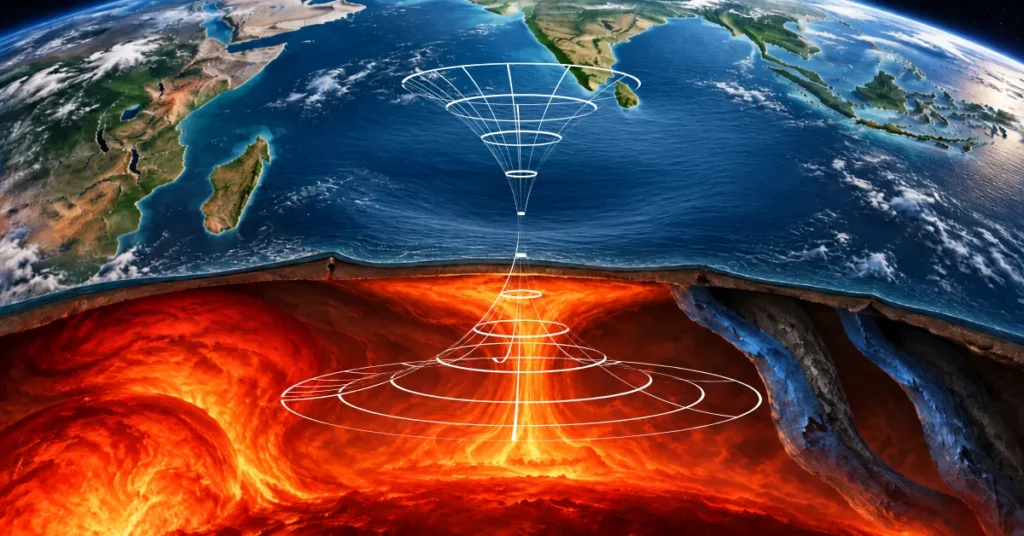
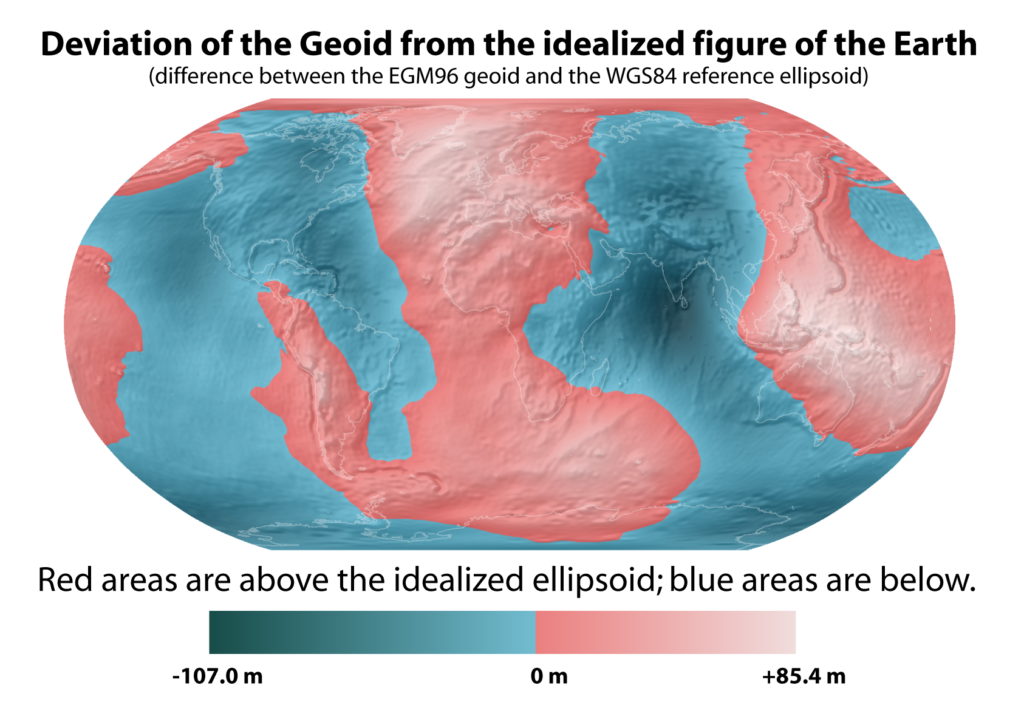
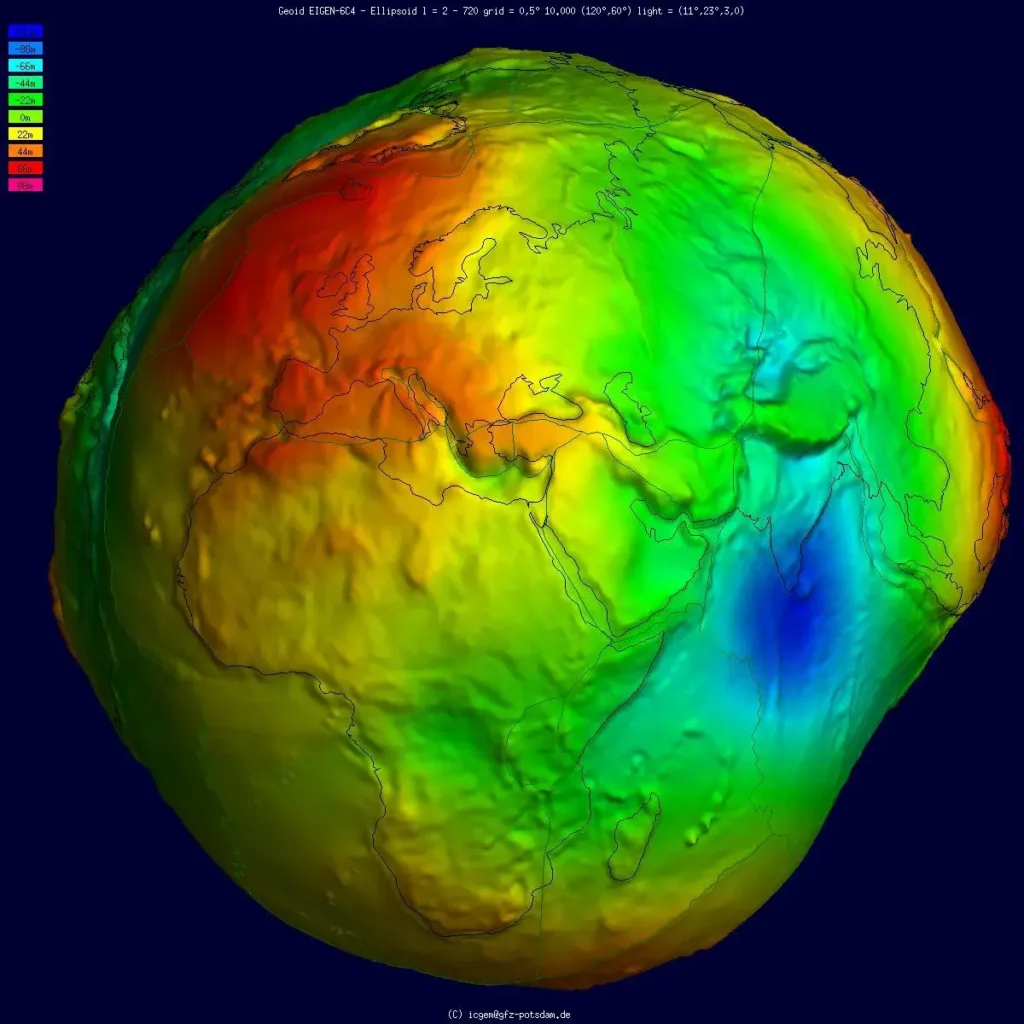
Roughly 1,200 kilometres south-west of the southern tip of India, the sea surface sags. Not visibly, not in a way any sailor would notice from the deck, not in any way that shows up on a tide chart. But if you stripped away the wind, the currents, the temperature gradients and every other thing that ruffles the ocean, you would see it: a circular depression about the size of the Indian subcontinent, three million square kilometres across, where the resting level of the sea sits roughly 106 metres lower than the average sea surface elsewhere on Earth. This is the Indian Ocean Geoid Low, popularly called the “gravity hole.” It is the largest gravity anomaly on our planet, and for 75 years nobody could agree on what put it there. In 2023, a pair of geophysicists at the Indian Institute of Science argued that the answer is a ghost. The dent in the sea, they said, is what remains of an ocean that died.
What a Geoid Actually Is
The lumpy potato Earth
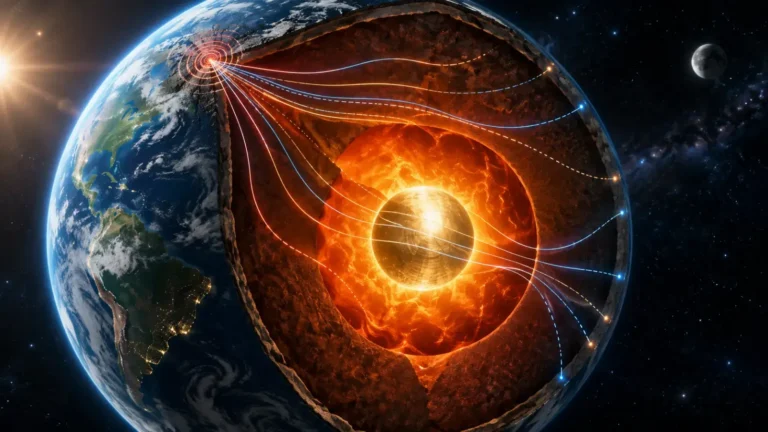
To talk about a 106-metre hole in the ocean, you first have to abandon the idea that Earth is round. It isn’t. Spin flattens it into an ellipsoid, with the equator bulging about 21 kilometres further from the centre than the poles. Then add the lumps: mountains, ocean trenches, dense slabs of rock buried hundreds of kilometres down, voids of hotter and lighter material rising from below. Each of those mass differences tugs on the gravity field a little harder or a little weaker than the bland ellipsoid predicts. “The Earth is basically a lumpy potato,” Attreyee Ghosh, a geophysicist at the Centre for Earth Sciences at IISc Bangalore, has said in describing this idea. The geoid is the shape that potato would take if you smoothed an ocean over the whole planet and let gravity decide where the surface settled.
Why sea level is not a single number
Sea level, in other words, is not one number. It is a surface, and a wonky one. Over the New Guinea geoid high it rises around 85 metres above the reference ellipsoid; over the Indian Ocean it falls by 106 metres. These are not bumps you can see from a ship. They are equipotential undulations, defined by the gravity field itself, and modern satellite missions like ESA’s GOCE and the joint NASA–DLR GRACE pair were built specifically to map them at metre-scale precision.
Vening Meinesz and the 1948 Discovery
The man who first realised something was wrong south of India never sailed there to look for it. Felix Andries Vening Meinesz was a Dutch geodesist, two metres tall, who had spent the 1910s mapping his country’s flat, marshy gravity field with a clever pendulum apparatus of his own design. Sediment-soaked Dutch ground refused to hold a single pendulum steady, so he built one with three pendulums swinging in opposite phases, their disturbances cancelled, their true period survived. Sailors aboard the cramped submarines that carried the instrument to sea took to calling it the Golden Calf.
From 1923 onward, Vening Meinesz rode submarines of the Royal Netherlands Navy across the world’s oceans, including the long K-XVIII voyage of 1934–35 through the East Indies. His apparatus, lowered 30 metres beneath the waves where surface chop dies down, made the first precise gravity measurements ever taken at sea. He found anomaly belts paralleling the Indonesian trenches, work that would feed directly into the theory of plate tectonics. But the gigantic low south of India did not announce itself in a single voyage. It emerged slowly, in the post-war synthesis of decades of submarine pendulum data with new shipboard and satellite measurements. By 1948, when Vening Meinesz published his consolidated gravity maps of the Indian Ocean region, the anomaly was unmistakable. There was a hole in the gravity field the size of a subcontinent, and nobody knew why.

Seventy-Five Years of Failed Explanations
The next three generations of geophysicists tried, and mostly failed, to explain what Vening Meinesz had found. The earliest serious attempt, by S. M. Ihnen and J. H. Whitcomb in 1983, blamed an isostatically uncompensated depression in the upper mantle, basically a crustal divot that had never been balanced out by buoyant roots. It did not work. The shape was wrong, the magnitude was wrong, and the negative anomaly extended too deep to be a near-surface feature. In 1987, J. G. Negi and colleagues proposed that the core–mantle boundary itself was deflected downward beneath the Indian Ocean. That model could match the magnitude, but the seismology has never supported it. Other groups blamed cold slab graveyards of subducted Tethyan lithosphere lying atop the core–mantle boundary, or dehydration of those slabs releasing fluids that lowered density in the mid-mantle, or paleo back-arc basins in the Neo-Tethys.
The first model to come close used something more dynamic. Attreyee Ghosh, working with G. Thyagarajulu and Bernhard Steinberger at GFZ Potsdam, published in Geophysical Research Letters in 2017 a mantle-convection calculation that drew flow from the seismic tomography itself. They concluded that the geoid low could only be reproduced if there was a low-density, low-velocity anomaly in the upper mantle stretching from roughly 300 to 900 kilometres depth beneath the northern Indian Ocean. Cold lower-mantle slabs alone, they argued, simply did not produce a geoid low in the right place. Bernhard Steinberger followed up in 2021 with a synthetic-density model in Tectonophysics showing that the IOGL sits exactly where a roughly north–south “ring” of high-density slabs in the lower mantle crosses a roughly east–west “streak” of low-density upper-mantle material running from East Africa. The location of the cross was, finally, a clue. The hot streak in the upper mantle pointed back to Africa, and to one of the strangest features in the deep Earth.
The 2023 Model: A Ghost Ocean and the African Blob
The streak Ghosh and Steinberger had identified pointed toward an immense thermo-chemical anomaly that sits on the core–mantle boundary beneath Africa: one of the two Large Low-Shear-Velocity Provinces that dominate the lowest 1,000 kilometres of the mantle. The two antipodal LLSVPs, beneath Africa and the Pacific, were first comprehensively reported by Su, Woodward and Dziewonski in 1994 and have since been mapped by every major global tomography model. They extend thousands of kilometres laterally and rise more than a thousand kilometres above the core–mantle boundary, occupying roughly 3 to 9 percent of Earth’s volume. Seismic shear waves slow down by about 0.5 to 1 percent through the shallow part of each province and by up to 3 percent at their base. The one under Africa is sometimes nicknamed Tuzo, and, less affectionately, the African blob. Its margins are widely thought to seed mantle plumes; the East African Rift, Réunion, Tristan and Iceland have all been linked to upwellings rooted at LLSVP edges.
In May 2023, Debanjan Pal, a doctoral student of Ghosh’s, and Ghosh herself published a paper in Geophysical Research Letters that pulled all of this together into a story with a beginning. Using the spherical-shell convection code CitcomS, they assimilated plate-tectonic reconstructions of the past 140 million years and ran 19 forward-in-time mantle convection simulations. They varied density parameters and rheology between runs. Of the 19, seven reproduced both a localised geoid low in the right place and the broader global geoid pattern, exceeding a regional correlation of 0.75 against the observed IOGL. Their representative case, Case 1, matched the long-wavelength temperature structure of independent seismic tomography (the TX2019S model) with a correlation between 0.8 and 0.9 below 1,500 kilometres depth.
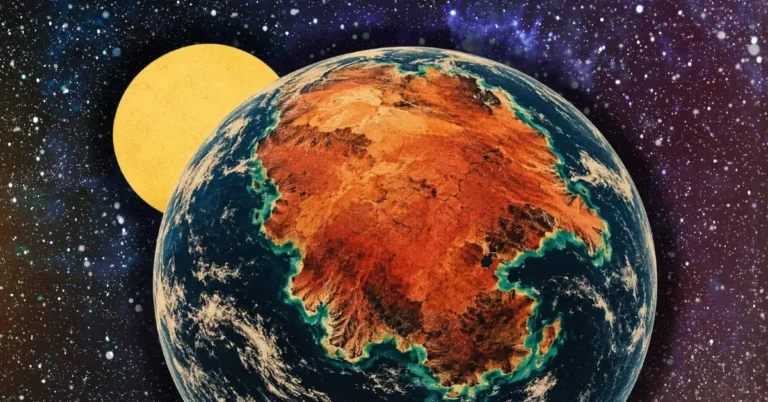
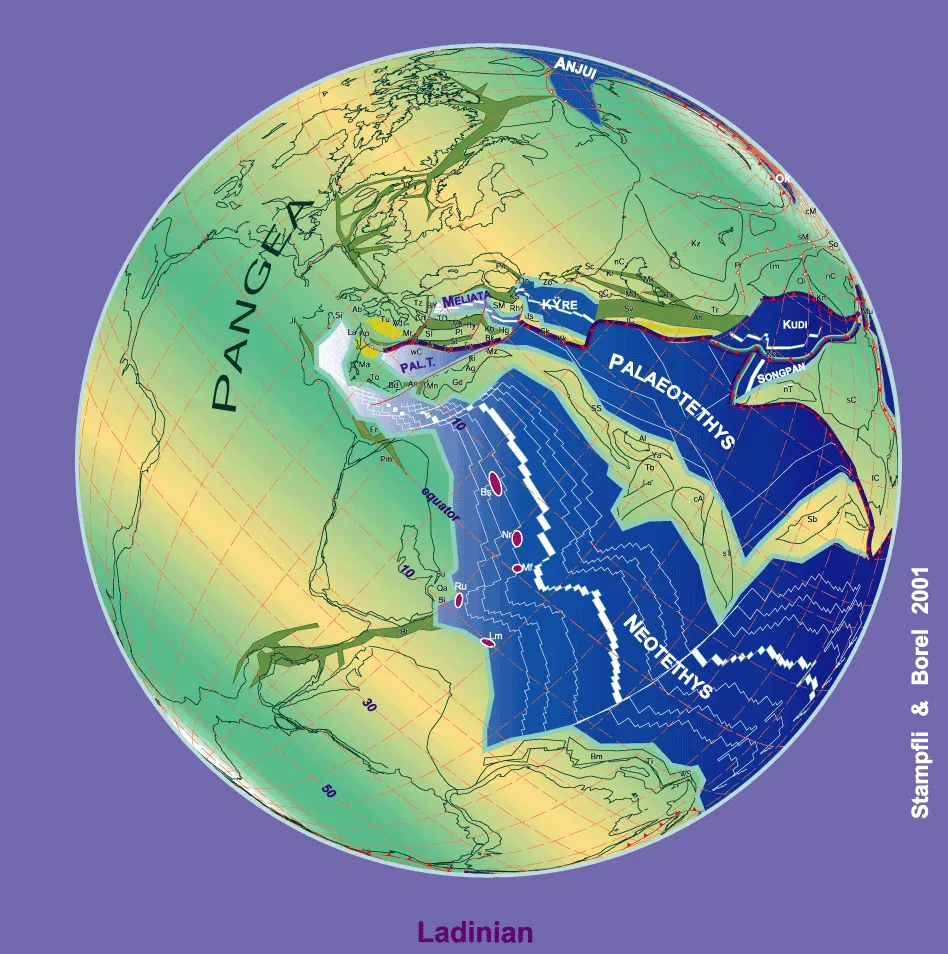
The story those models tell goes like this. About 140 million years ago, India was part of Gondwana, sitting where Madagascar still does, separated from Eurasia by a vast intervening ocean called the Tethys. As India broke away and rocketed north, at roughly 15 centimetres per year, about twice as fast as the fastest modern tectonic drift, according to Jagoutz and Royden’s 2015 Nature Geoscience analysis of the collision, the Tethyan seafloor was systematically consumed beneath the southern margin of Asia. Cold, dense oceanic lithosphere sank thousands of kilometres into the mantle. By around 50 million years ago, India collided with Asia and began to build the Himalayas; by then, the leading edges of the old Tethyan slabs had reached the core–mantle boundary.
Those slab graveyards, in the Pal–Ghosh models, did something interesting. They perturbed the African LLSVP, nudging its eastern margin. Hot, low-density material rose from the LLSVP’s edge as a plume, was steered eastward beneath the speeding Indian plate, and pooled in the upper mantle between roughly 300 and 900 kilometres depth beneath what is now the Indian Ocean. The geoid low we see today, the models found, only really took its present shape about 20 million years ago, once the plumes had spread laterally enough in the upper mantle to produce a deep, broad mass deficit. “What we’re seeing is that hot, low-density material coming from this LLSVP underneath Africa is sitting underneath the Indian Ocean and creating this geoid low,” Ghosh told Scientific American when the paper appeared. The dent in the sea, in their reading, is the work not of the Tethys directly but of its ghost: the long-buried slabs of a vanished ocean, still stirring the deep mantle hundreds of millions of years later.
The Seismic Test from the Indian Ocean Floor
A convection model is not a measurement. To know whether the Pal–Ghosh story is right, you have to listen to the mantle. India’s National Centre for Polar and Ocean Research (NCPOR), through a Ministry of Earth Sciences programme, has been trying to do exactly that. Through this programme, NCPOR teams led by Dhananjai Pandey deployed, for the first time in the region, a focused linear array of 17 broadband ocean-bottom seismometers across the centre of the IOGL. The instruments sat on the abyssal seafloor recording teleseismic earthquakes from around the world. The instruments sat on the abyssal seafloor recording teleseismic earthquakes from around the world.
The instruments revealed something striking. In a 2022 Tectonophysics paper, Sanjay S. Negi, Amit Kumar, Lachit S. Ningthoujam and Pandey used P-to-S receiver functions from the array to map the mantle transition zone, the depth interval between the 410-kilometre and 660-kilometre seismic discontinuities, directly beneath the IOGL. They found a depression of both discontinuities along a roughly 800-kilometre-wide stretch of transition zone, with estimated excess temperatures of 140 to 558 K at 410 km and 200 to over 1,000 K at 660 km. A companion paper by Kumar and colleagues, also in Tectonophysics in 2022, used surface-wave phase velocities from the same array and found a thick low-velocity zone in the upper mantle beneath the geoid low, consistent with hot, buoyant material.
This is the first direct seismic evidence of a hot thermal anomaly extending from the transition zone up into the asthenosphere beneath the IOGL. It supports the broad Pal–Ghosh picture of an upper-to-mid-mantle low-density anomaly sourced from a deep plume. It does not, however, image the plume’s connection to the African LLSVP. The OBS array is too narrow a line to resolve that. It confirms there is something hot beneath the geoid low. It does not show whether that heat connects down to the African LLSVP, where the convection models root it.
The Critique: What About the Réunion Plume?
The strongest scientific objection to the Pal–Ghosh model came from Alessandro Forte, a geophysicist at the University of Florida who has spent his career on exactly this kind of dynamic geoid modelling. Speaking to CNN’s Jacopo Prisco in July 2023, Forte praised the inclusion of hot rising plumes, an improvement on older models that simulated only cold sinking slabs, but he flagged a serious omission.
“The most outstanding problem with the modeling strategy adopted by the authors is that it completely fails to reproduce the powerful mantle dynamic plume that erupted 65 million years ago under the present-day location of Réunion Island. The eruption of lava flows that covered half of the Indian subcontinent at this time, producing the celebrated Deccan Traps, one of the largest volcanic features on Earth, have long been attributed to a powerful mantle plume that is completely absent from the model simulation.”
This is not a small omission. The Deccan Traps eruption at the end of the Cretaceous is one of the best-documented plume events in the geological record, with isotopic and geochemical fingerprints linking it directly to today’s Réunion hotspot. If a mantle convection model purporting to explain the gravity field beneath the modern Indian Ocean cannot generate the very plume that built the Deccan Traps, something important is missing. Forte also pointed out discrepancies between the modelled global geoid and the observed one over the Pacific, Africa, and Eurasia, suggesting that the Case 1 success might be partly a local fit rather than a globally consistent dynamic explanation. He noted that the authors themselves reported only “a moderate correlation, around 80 percent” between the predicted and observed geoids, without giving a precise numerical measure.
Ghosh has been frank about the limits. “We do not know with absolute precision what the Earth looked like in the past,” she told CNN. “The farther back in time you go, the less confidence there is in the models… But we believe the overall reason for this low is quite clear.” Huw Davies, a mantle geodynamicist at Cardiff University, offered the polite middle ground: the work, he said, is “certainly interesting, and describes interesting hypotheses, which should encourage further work on this topic.”
That is roughly where the field stands. The Pal–Ghosh model is the best dynamic, time-dependent explanation anyone has produced for the IOGL. It is broadly consistent with the OBS seismology. It is not yet seismically confirmed below the transition zone, and it fails to reproduce one of the largest known plume events in the same region.
Will the Gravity Hole Ever Disappear?
Whatever made the IOGL is still making it. Pal and Ghosh estimate that the anomaly took its current shape only about 20 million years ago, once upper-mantle plumes had spread laterally enough to depress the geoid. As long as hot material continues to flow from the edge of the African LLSVP into the upper mantle beneath the Indian Ocean, the dent will persist. But the mass anomalies in the deep Earth are not static. Plate motions are reshuffling subducting slabs, the African LLSVP is itself slowly deforming, and the Indian plate continues to push north into Asia. “When the temperature anomalies causing this low geoid shift out of the present-day location,” Pal told Scientific American, “the geoid low will start to dissipate.”
On the timescales that matter to mantle dynamics, tens to hundreds of millions of years, the IOGL is a transient feature, younger than the dinosaurs’ extinction and roughly the age of the modern Himalaya. Eventually it will heal.
Why the Indian Ocean Gravity Hole Matters
Beyond the satisfaction of solving a 75-year-old geophysical mystery, the IOGL story has real reach. It tightens the link between satellite geodesy, the GOCE and GRACE missions that mapped the geoid in unprecedented detail, and the convective machinery of the deep mantle, the same machinery that drives plate tectonics, sustains the magnetic field via the core, and shapes deep Earth dynamics we are only beginning to read. It refines the sea-level reference frames used for everything from climate-driven tide-gauge analysis to ocean circulation models. And it reminds us that even the largest, most stable-looking features on a globe are echoes of motion happening hundreds of kilometres below our feet. The same deep mantle that hides oceans’ worth of deep-mantle water inside hydrous ringwoodite is, in the Indian Ocean, slowly redrawing the shape of the planet’s surface.
Frequently Asked Questions
What is the Indian Ocean “gravity hole”?
It is the Indian Ocean Geoid Low (IOGL), a roughly circular region about three million square kilometres across, centred around 1,200 km southwest of the southern tip of India, where Earth’s gravity is weaker than average. Because of that weaker pull, the resting sea surface there sits about 106 metres lower than the global average. It is the largest gravity anomaly on Earth.
Why is sea level lower over the Indian Ocean Geoid Low?
Sea level follows the geoid, an equipotential surface shaped by the distribution of mass inside the Earth. Beneath the IOGL there is a deficit of massm a region of hot, low-density material in the upper-to-mid mantle, so the gravitational pull is weaker and the equilibrium sea surface dips.
What causes the Indian Ocean Geoid Low?
In the leading 2023 model by Debanjan Pal and Attreyee Ghosh, sinking slabs of the ancient Tethys Ocean perturbed a vast hot structure beneath Africa (the African Large Low-Shear-Velocity Province), sending plumes of low-density material that pooled in the upper mantle beneath the Indian Ocean. This mass deficit, the models find, produced the geoid low, which took its present shape about 20 million years ago. The explanation is supported by ocean-bottom seismic data but is not yet fully confirmed at depth.